The big leagues

This is the 7th and last post in my Visualization with React series. Previous post: Creating a React visualization web app

We can finally take the little wheels off and create a real React app.
That’s what we’ll make:
App screenshot
You can try the app for yourself here. The code is available on github.

This time, instead of loading data from a paltry CSV file, we’ll go live and hit the openweathermap API and get live weather data.

The app may be more complex than anything we’ve done before, but it’s really more of the same, so I’ll be probably quicker.

First, look at the secrets.json file. As you can guess, it can’t work as is – if you want to try this at home, you must get your own (free) API key from openweathermap.

Next, let’s take a look at our constants.js file.
At this stage, you might ask: why not put the API key in that constants file? Well, it’s good practice to never store your API keys in your code. So, I put it in a separate file.
Constants.js is pretty simple. It has: a url prefix (that of the openweathermap api). If they change it, I can just edit the constants file. The CITY_ID holds the identifier of San Francisco. You can replace it by whatever you want (it’s not too difficult to find the city_id for any given city at the OWM web site).
Finally, I have a json object called KEYS where I store what I’m interested in getting from the API.

Let’s move to the App.js file, which is the top-level react file.

import React, { Component } from 'react';
import './App.css';
import '../node_modules/react-vis/main.css';
import {json} from 'd3-request';
import * as CONSTANTS from './constants';
import secrets from './secrets.json';
const {API} = secrets;

Note that I can import my json file like a code file.

We start, unsurprisingly, by creating an App component, and by a constructor method.

class App extends Component {
  constructor(props) {
    super(props);
    this.state = {
      highlighted: null
    };
    this.highlightX = this.highlightX.bind(this);
    this.processResults = this.processResults.bind(this);
  }

We initialize the state, and bind two methods. Nothing we haven’t seen.

  componentWillMount() {
    json(`${CONSTANTS.QUERY_PREFIX}?id=${CONSTANTS.CITY_ID}&appid=${API}&units=imperial`,
      this.processResults);
  }

Things get interesting with the componentWillMount method.
We use our d3-request json function to read the url in the first line, which we compose by joining the URL prefix, the city id, the api key, and I’ve added ‘units=imperial’ so that temperatures are in Farenheit. Feel free to change this to units=metric or remove it (in which case temperatures will be in Kelvin, why not).
The second argument of the json function is what is done with the request – this is our first private method, processResults, which is what comes next.

 processResults(error, queryResults) {
    if (error) {
      this.setState({error});
    }
    const data = CONSTANTS.KEYS.map(key => ({
      key,
      values: queryResults.list.map((d, i) => ({
        i,
        x: d.dt * 1000,
        y: d[key.key1] ? d[key.key1][key.key2] || 0 : 0 
      }))
    })).reduce((prev, curr) => {
      return {...prev, [curr.key.name]: curr.values}
    }, {
      'city-name': (
        queryResults &&
        queryResults.city &&
        queryResults.city.name
      ) || 'Unkown'
    });
    this.setState({data});
  }

If the data can’t load, error will have a value, and we’ll pass it to the state.
Else, we’re going to process the result of the query (queryResults) according to the structure that we want (CONSTANTS.KEYS).
Here, I’m using a sequence of map and reduce.
Map turns an array into another array of the same shape. Reduce turns an array into something else, such as an object as here.
queryResults is an object which has a list property. queryResults.list is an array of nested objects. This is why each entry of CONSTANTS.KEYS specifies two keys.
To simplify, one of these objects could look like this:

{
  "dt": 1471413600,
  "main": {
    "temp": 57.22,
    "temp_min": 53.32,
    "temp_max": 57.22,
    "pressure": 1017.57,
    "sea_level": 1025.63,
    "grnd_level": 1017.57,
    "humidity": 100,
    "temp_kf": 2.17
  },
  "weather": [
    {
      "id": 500,
      "main": "Rain",
      "description": "light rain",
      "icon": "10n"
    }
  ],
  "clouds": {
    "all": 24
  },
  "wind": {
    "speed": 3.42,
    "deg": 234.501
  },
  "rain": {
    "3h": 0.02
  },
  "sys": {
    "pod": "n"
  },
  "dt_txt": "2016-08-17 06:00:00"
}

So, if I’m interested in the temperature, I have to get it from main, then temp. (two keys)
For each entry of CONSTANTS.KEYS, I’m mapping queryResults to create a time series of objects with three properties: in x, a date in timestamp format (number of milliseconds since 1970). in y, the value I’m interested in. and in i, the index of that object in the time series.

When I’m done mapping CONSTANTS.KEYS, I have an array of such time series, or more exactly: an array of objects with a name property (which comes from CONSTANTS.KEYS) and a values property (the array of objects described above).

Finally, I’m reducing it to an object using reduce.
The reduce method works like this:

myArray.reduce(function(prev, curr) {
  // operation involving the previous result (prev) and the current element of the array (curr)
  return resultOfThatOperation;}, // which becomes prev in the next loop
  initialValueOfReduce) // which will go into prev the first time 

What mine does is turn that array into an object. The keys of that object are the name property of each element, and the values are what’s behind the values property of that object (our time series).
And that final object has an extra property: city-name, the name of the city for which weather is being queried, if it exists.

When this object is created, we send it to the state.

  highlightX(highlighted) {
    this.setState({highlighted});
  }

highlightX is our other private method. What it does is send whatever it’s passed to the state. But since we create it here, it will pass that to the state of App, the top level component. If that state is changed, all the children (ie everything) may be re-rendered.

Finally, we have our render method.
We’ll skip on the styling – codewise, we’ll see that this method calls two components, LargeChart and SmallChart, with similar properties:

<LargeChart
  highlighted={highlighted}
  highlightX={this.highlightX}
  series={data.Temperature}
  title='Temperature'
/>

// ...

<SmallChart
  highlighted={highlighted}
  highlightX={this.highlightX}
  series={data.Pressure}
  title='Pressure'
/>

highlighted comes from the state of App.
highlightX is the callback method. We’ve seen this before – we give children components the ability to change the state of their parent, and we also pass them the result of that change.
Else, we pass to each component a part of our data object, and a different title.

Let’s move on to the large chart component:

import React, { Component } from 'react';
import moment from 'moment';
import {
  LineSeries,
  makeWidthFlexible,
  MarkSeries,
  VerticalGridLines,
  XAxis,
  XYPlot,
  YAxis
} from 'react-vis';

const HOUR_IN_MS = 60 * 60 * 1000;
const DAY_IN_MS = 24 * HOUR_IN_MS;

const FlexibleXYPlot = makeWidthFlexible(XYPlot);

so far, we’re importing a bunch of stuff.
the two constants that we create are the numbers of milliseconds in an hour, and in a day, which will be useful in a bit.
FlexibleXYPlot is a special react-vis component that can resize (in width). By using this as opposed to XYPlot with a fixed width, we can make our app layout responsive (try resizing the window!) without having to think too hard it.

export default class LargeChart extends Component {
  render() {
  	const {highlighted, highlightX, series} = this.props;
   	const minValue = Math.min(...series.map(d => d.y));
  	const maxValue = Math.max(...series.map(d => d.y));

  	const yDomain = [0.98 * minValue, 1.02 * maxValue];
  	const tickValues = series.map(d => d.x);

    const labelValues = makeLabelValues(series);

Eh, we could have made a pure functional component, since this one only has a render method and no state.
First, we come up with the bounds of the domain. We don’t have to. Note the use of the spread operator for a very concise way to write this.
We create yDomain with a little bit of margin – we start with 98% of the smallest value, and go to 102% of the maximum value.
If we don’t define a domain, then react-vis will create it based on the data – it will start with exactly the smallest value and end with exactly the highest.

tickValues will be all the different x values.
labelValues will be created by a separate function (in the end). We’ll write a label for every day of our time series at precisely midnight.

Now we’ll create the chart proper.

<FlexibleXYPlot
    	height={300}
    	margin={{top: 5, bottom: 25, left: 40, right: 0}}
    	onMouseLeave={() => this.props.highlightX(null)}
    	yDomain={yDomain}
    >
    	<VerticalGridLines 
    		values={labelValues}
    	/>
        <HorizontalGridLines />
    	<LineSeries 
    		data={series}
    		onNearestX={highlightX}
    		stroke='#11939a'
    		strokeWidth={2}
    	/>
    	{highlighted ? 
    		<LineSeries
    			data={[
    				{x: highlighted && highlighted.x, y: yDomain[0]},
    				{x: highlighted && highlighted.x, y: yDomain[1]}
    			]}
    			stroke='rgba(17,147,154,0.7)'
    			strokeWidth={2}
    		/> : null
    	}
       {highlighted ?  
       <MarkSeries
          data={[{
            x: highlighted && highlighted.x,
            y: highlighted && series[highlighted.i].y
          }]}
          color='rgba(17,147,154,0.7)'
        /> : null
        }
    	<XAxis 
    		tickSize={4}
    		tickValues={tickValues}
    		labelValues={labelValues}
    		labelFormat={(d) => moment(new Date(d)).format('MM/DD')}
    	/>
        <YAxis 
        	tickSize={4}
        />
    	
    </FlexibleXYPlot>

The first interesting thing is the onMouseLeave property of FlexibleXYPlot. If the mouse leaves the chart, we’ll use our highlightX callback function to pass “null” to the state of App.
In other words, when the mouse is not on a chart, the value of highlighted is null.

A bit later, we see that the first LineSeries has an onNearestX property. What it does is that when somebody mouseovers the chart, it sends the underlying datapoint to the state of App. Remember that these datapoints are objects with three property: x, i and y.

So, at a given moment, highlighted is either null, or of the form: {x: (a date in timestamps format), y: (a value), i: (the position of that datapoint in the time series, ie 10 if that’s the 10th point)}.

Let’s go on.
There’s an interesting construct between curly braces. Remember that in JSX, whatever is between curly braces will be evaluated. Here, we have a ternary operator (condition ? true : false). If highlighted exists, then we will create a LineSeries, else nothing.
What this means is that if there’s a value for highlighted, we are going to draw a vertical line that spans the whole chart, at the level of the mouseover.
We then have a similar construction for a MarkSeries, which, likewise, draws a circle at the same position as the highlighted data point.

Finally, we create the axes. The XAxis has a few interesting properties: tickValues, which we defined above – all the possible x values, labelValues and labelFormat. labelValues determine where the labels will be drawn. Finally, labelFormat determines what will be drawn, as a function of each value in labelValues.

export function makeLabelValues(series) {
  const firstDate = new Date(series[0].x);
  const firstDateHour = firstDate.getHours();
  const firstMidnight = series[0].x + (24 - firstDateHour) * HOUR_IN_MS;

  return [0, 1, 2, 3, 4].map(d => firstMidnight + d * DAY_IN_MS);
}

the last part of this module creates those label values.

Our time series has a number of elements (normally 39), every 3 hours. But the first element is probably not the very beginning of a day. We’d like our labels to be exactly aligned with the start of a day (midnight).
So we are going to figure out what time it is on the first element of the time series, compute when exactly is the next day, and then create an array of 5 values corresponding to the time we just computed, then the time 24 hours after (start of the next day), the time 24 hours after that, etc.
As a result, we’ll have a list of 5 ‘midnights’ exactly a day apart.

Finally, let’s look at SmallChart.

SmallChart is very similar to LargeChart. The styling is a bit different (these charts are, well, smaller). The Smallchart component also have an onNearestX hook that sends a datapoint to the state of App.
Unlike LargeChart, it doesn’t draw a vertical line; it just draws a dot on the curve corresponding to the highlighted time.

So, since App sends the same highlighted to all chart components, mousing over any chart makes that dot appear on all charts. How do we know where to draw it?
If I mouseover on a chart, onNearestX will send to its corresponding callback function the underlying datapoint, that has an x and a y property (and possibly others). If I wanted to draw a dot on that same chart, that would be easy – I already know the x and y coordinates where I would have to draw it. But how can I draw a dot on all the other charts?
This is why I added that i property to the timeseries to begin with. When I mouseover on a point on any chart, the object I send to App’s state has that i property. In other words, I can know that I’ve mouseovered the 10th point of the chart (or the 17th, or the 3rd, etc.). When the LargeChart and SmallChart components will draw the dot, they will draw it on top of the 10th (or 17th, or 3rd… well, the i-th) point of their own chart.

<MarkSeries
  data={[{
    x: highlighted && highlighted.x,
    y: highlighted && series[highlighted.i].y
  }]}
  color='rgba(17,147,154,0.7)'
  size='2'
/>

That’s what series[highlighted.i].y means.

And that’s it! A complete dashboard with linked charts. You can tell that temperature is lower at night, and probably lower when there are clouds, but then again it’s San Francisco so it’s probably always 60 more or less.

This project could be much more complex – we could have added a tooltip like in our previous app… added extra series… and arranged info in a lot of different ways. We could also let the user change the city through a text box. Well, you can make your own version!

(if you’re curious why I haven’t hosted this app on github, it’s because we can only access an HTTP version of the OWM API for free, and since github pages are hosted over HTTPS those requests will be blocked.)

Now, what

Congratulations for reading that far, you are awesome.
So you want to take your react game to the next level and do amazing visualizations?
You should continue exploring react-vis. I’ve only used a very basic case. We use it at Uber to create pretty elaborated charts and dashboards.
Our visualization team is also behind three amazing open source libraries which play well with React: React-Map-GL, to create maps with MapBox and React; Deck.gl, to create webGL layers over maps, and Luma.gl, a WebGL framework.

One of the best features of React is that it has so many existing modules. React-motion is, IMO, the best way to handle animation in React as of now, especially when SVG elements are concerned. Check out that great article by Nash Vail.

The React project page is an evident resource. React is alive, keeps adding features, and there is constantly more code out there using react and pushing the envelope.

The Airbnb style guide is a solid reference for writing good modern javascript. We don’t follow it at Uber; we have slightly different rules, which are not published. Anyway, the best part of such a system is its consistency, and Airbnb style guide is definitely consistent.

React Rocks! is a great collection of examples and a source of inspiration.

Once your application become complex enough, it’s difficult to handle states and callbacks everywhere. You can use a store to address this. Right now the state of the art solution is redux. The author of Redux, Dan Abramov, gives an amazing video tutorial which doubles as an excellent showcase for React and ES6.


Creating a React visualization web app

This is the 6th post in my Visualization with React series. Previous post: Beyond rendering

Playing with codepen is fun, but chances are that you have other ambitions for your visualization projects. In the real world, well, in my day job at least, React is used to create web apps. So, in that last part, we’re going to create our own web app, load some real data, and use some existing modules to visualize it like pros! In this article, we are going to build this:

You can try a demo of the app at https://jckr.github.io/example-react-app/.
All the code is at https://github.com/jckr/example-react-app.

What’s the difference between a web app and a web page you may ask? Well, a web page is an html document with some links to scripts or some inline javascript. A web app is a comprehensive system of code files working together, including a server. All of these files are transformed via a build system, which creates a compiled version that runs on the browser. Such transformations can include JSX support, or supporting ES6/ES7 syntax. Your work can be split in many, easy to read, easy to maintain source files, but your browser will just read one single file written in a version of Javascript it can understand.

That may sound like a lot of work to setup. Up to a few weeks ago, the easiest way to get started was to use a web scaffolding tool such as Yeoman. Scaffolding means that all the little parts that need to be installed or configured to get that going are taken care of, leaving you with a structure that you can use to build your web app upon.
Facebook recently released ‘create-react-app’, which is a simpler scaffolding tool, aimed at simple React apps.

You will need access to a command line environment, such as Terminal on MacOS or Cygwin on windows, and have nodejs and npm installed. (see https://nodejs.org/en/). You will need node version 4 and above. You may want to use nvm to easily change versions of node if needed.

Here’s an illustrated guide to what you need to do to get started:

First, install create-react-app with the command: npm install create-react-app -g.

From the parent directory where you want your app to be, use the command: create-react-app + the name of your app. This will also be the name of the directory this app will be in.

The above command will copy a bunch of files. When it’s done, go to the directory of your app and type npm start…

And lo and behold, the app will start and a browser window will appear with the results!
From now on, whenever you change one of the source files, the app will reload and reflect the changes.

Remember when we did scatterplots, I never really got into doing the menial work of making gridlines, axes etc. Exactly for this reason – it can be a lot of manual work.
But now that we are going to build a professional looking web app, we are going to go all the way.

One component, one file

The app we are building has 3 components: the App, which is the parent; Scatterplot, which is the chart proper and HintContent, for some fine control about what the tooltip looks like.
There an index.html and an index.js file, which are very simple:

<!doctype html>
<html lang="en">
  <head>
    <meta charset="utf-8">
    <meta name="viewport" content="width=device-width, initial-scale=1">
    <title>React App</title>
  </head>
  <body>
    <div id="root"></div>
  </body>
</html>
import React from 'react';
import ReactDOM from 'react-dom';
import App from './App';
import './index.css';

ReactDOM.render(
  <App />,
  document.getElementById('root')
);

There’s really not much to say about the index.html. All it does it create a div with an id of root, where everything will go.
The index.js ends with the familiar command ReactDOM.render( … ), which will output our component into the aforementioned root div.

But it starts with a few import statements. What they do is that they link the source files together.
Index starts by importing functionalities from react: React and ReactDOM. This was done in our codepen environment by using the settings.
The next two lines link our index.js file with other files that we control: App and index.css. App contains our highest-level component, and index.css contains the styles.
I’ve done some changes in index.css for styles I couldn’t reach with react – styles of the body, for instance, or some styles of elements created by libraries over which I didn’t have direct control (more on that later). Else, I’m using inline styles, in the React tradition.

Let’s move to our App.js source file, which describes the App component.

Its last line is:

export default App;

And this is the line which corresponds to what we had seen earlier in index.js:

import App from './App';

With this pair of statements, inside of index.js, App will be equivalent to what it was inside of App.js when exported.
Using this construct, using import and export, files can be kept short, legible and focused on one specific problem.

But let’s take another look at the first two lines of App.js:

import React, {Component} from 'react';
import {csv} from 'd3-request';

What are those curly braces?

If a module (a javascript file which imports or exports) has a default export, then when importing it, you can just use

import WhatEverNameYouWant from 'module'; 

Where WhatEverNameYouWant is actually whatever name you want. Typically, it would start by an uppercase letter, but you do you.
But a module can export other things than the default export. In that case, you have to use curly braces. There’s many articles on the subject such as this one. I’m mostly bringing it up so that you see there’s a difference between using the curly braces or not.

In our source files, we are going to use export default. We are also going to define one component only per source file, which makes the whole import / export deal easier to follow.

create-react-app has no dependencies beyond react – which means that it doesn’t need other modules to be installed. But this project does! It needs d3-request and react-vis.
You can install them from the command line, by typing npm install d3-request –save, and npm install react-vis.

The App component – loading and passing data

Our app component will do two things: load the data, and when the data is loaded, pass it to the Scatterplot component so it can draw a chart.
I’ve hinted at the componentWillMount lifecycle method as a great place to load data, so let’s try that!

class App extends Component {
  constructor(props) {
    super(props);
    this.state = {};
  }

I’m starting with the constructor method. The only reason why I do that is to initialize the state to an empty object. If I didn’t, the state would initially be undefined. And while it’s not a deal-breaker, I would have to add more tests so that the app doesn’t break before there’s anything actually useful in the state.

  componentWillMount() {
    csv('./src/data/birthdeathrates.csv', (error, data) => {
      if (error) {
        this.setState({loadError: true});
      }
      this.setState({
        data: data.map(d => ({...d, x: Number(d.birth), y: Number(d.death)}))
      });
    })
  }

ComponentWillMount: there we go.
we are using the same data file as before. Here, I’ve hardcoded it in a string, but that address could totally come from a property passed to App.
Also, note I’m using csv from d3. That used to be d3.csv, but not anymore because I’m importing just csv from d3, or more precisely from its sublibrary ‘d3-request’. One of the big changes of d3 v4, also recently released, is that its code is available as smaller chunks. There are other ways to load a csv file, but d3’s csv method is super convenient and it’s also a great way to show how to cherrypick one useful part of a large library.

So, we are loading this file. What’s next? If loading the file raises an error, I am going to signal it via the state (setState({loadError: true});). Else, I am going to pass the content of the file to the state.
Not just the raw contents: I am going to slightly transform it. Inside the csv method, data is an array of objects corresponding to the columns of my file. There are three columns: country, birth and deaths. I have therefore arrays with three properties, and their values is what is being read by csv from the file, as strings.
The map statement turns that object into: a copy of all these properties (that’s what {…d does), plus x and y properties which simply convert the birth and deaths properties of each object to numbers (ie “36.4” to 36.4).
So, whether this file succeeds or fails to load, I’m going to change the state of the component.

What values can the state take?

When the component is first created, state is empty.
Then, componentWillMount attempts to load the file. State is still empty. During that very short time, render will fire (more on that soon).
Then, the file will either load or not. If it loads, state will now hold a data property, and since state changes, the component will re-render. If it doesn’t load, state will have a loadError property and the component will also re-render.

Which takes us to the rendering of the component. You’ll see that these 3 situations are taken care of.

render() {
    if (this.state.loadError) {
      return <div>couldn't load file</div>;
    }
    if (!this.state.data) {
      return <div />;
    }
    return <div style={{
      background: '#fff',
      borderRadius: '3px',
      boxShadow: '0 1 2 0 rgba(0,0,0,0.1)',
      margin: 12,
      padding: 24,
      width: '350px'
    }}>
      <h1>Birth and death rates of selected countries</h1>
      <h2>per 1,000 inhabitants</h2>
      <Scatterplot data={this.state.data}/>
    </div>;
  }

if (this.state.loadError) – that’s the situation where the data didn’t load. That’s also why I did initiate state to an empty object, because if this.state was undefined, this syntax would cause an error. (this.state && this.state.error) would be ok, but I might as well just initialize the state.

if (!this.state.data) takes care of the situation where the data didn’t load yet. We also know that there hasn’t been an error yet, else the first condition would have been triggered. In a professional setting, that’s where you’d put a progress bar or a spinner. Loading a 70 line csv isn’t going to take long though, so that would be over the top, which is why there’s just an empty div.

Finally, if neither of these conditions are met, we are going to render a card with a Scatterplot element inside. We’re going to render a little more than just the Scatterplot element – we’re styling the div on which it will stand and adding some titling.

The Scatterplot component: introducing react-vis

React-vis is the charting library we use at Uber.
The main idea is that we can create charts by composing elements, just like a web page:

<XYPlot
  width={300}
  height={300}>
  <HorizontalGridLines />
  <LineSeries
    data={[
      {x: 1, y: 10},
      {x: 2, y: 5},
      {x: 3, y: 15}
    ]}/>
  <XAxis />
  <YAxis />
</XYPlot>

… creates a very simple line chart with horizontal gridlines and axes. Don’t want the gridline? remove the part. Want vertical gridlines too? Just add underneath.
Do you need another line chart? You can add another LineSeries element. Or a VerticalBarSeries. Or a RadialChart (pie or donut charts). And so on and so forth.
React-vis handles all the nitty gritty of making charts, so we don’t have to.

Let’s dive into Scatterplot.

import React, {Component} from 'react';
import {
  Hint,
  HorizontalGridLines,
  MarkSeries,
  VerticalGridLines,
  XAxis,
  XYPlot,
  YAxis
} from 'react-vis';

scatterplot.js starts by familiar import statements. We only import what we need from ‘react-vis’.

import HintContent from './hint-content.js';

Then, we import HintContent – hint-content.js uses a default export, so no need for curly braces. By the way, that .js extension is not mandatory in the file name.

export default class Scatterplot extends Component {
  constructor(props) {
    super(props);
    this.state = {
      value: null
    };
    this._rememberValue = this._rememberValue.bind(this);
    this._forgetValue = this._forgetValue.bind(this);
  }

  _rememberValue(value) {
    this.setState({value});
  }

  _forgetValue() {
    this.setState({
      value: null
    });
  }

We could have made Scatterplot a pure functional component… if we had passed callback functions for handling mouseover. Those functions could have changed the state of the App component, which would re-render its children – Scatterplot. Since no component outside of Scatterplot is interested in knowing where the mouse is, that component can have its own state.
We are also adding two private functions. They have to be bound to “this” – we are creating a class, and those functions have to be tied to each instance of that class. The other way to think about it is: you can add private functions to a React component, but if they use the state, properties or private variables, you will have to bind them to ‘this’ in the constructor.

render() {
    const {data} = this.props;
    const {value} = this.state;
    return <div>
      <XYPlot
        margin={{top:5, left: 60, right: 5, bottom: 30}}
        width={320}
        height={290}>
        <VerticalGridLines />
        <HorizontalGridLines />
        <XAxis/>
        <YAxis/>
        <MarkSeries
          data={data}
          onValueMouseOver={this._rememberValue}
          onValueMouseOut={this._forgetValue}
          opacity={0.7}
        />
        {value ?
          <Hint value={value}>
            <HintContent value={value} />
          </Hint> :
          null
        }
      </XYPlot>
      <div style={{
        color: '#c6c6c6',
        fontSize: 11,
        lineHeight: '13px',
        textAlign: 'right',
        transform: 'rotate(-90deg) translate(120px, -160px)'
      }}>Death Rates</div>
      <div style={{
        color: '#c6c6c6',
        fontSize: 11,
        lineHeight: '13px',
        textAlign: 'right',
        transform: 'translate(-5px,-14px)',
        width: '320px'
      }}>Birth Rates</div>
    </div>;
  }

What we are returning is a div element. The reason is that at the very end, we are writing the name of the axes on that div. But mostly, that div will hold a XYPlot component, which comes from react-vis. I’m passing: a margin property, a height and a width. Margin is optional and I’m using it for control. Height is mandatory, width as well, though react-vis has a responsive component that makes the charts adapt to the width of the page (not used here).
Then, I’m simply adding: horizontal and vertical gridlines, and horizontal and vertical axes. I’m using default settings for all of them (full disclosure – I’ve changed a few things via the index.css stylesheet). But the way labels and lines are organized is fine by me.
Then, we’re adding the MarkSeries component, which is all the circles.

 <MarkSeries
  data={data}
  onValueMouseOver={this._rememberValue}
  onValueMouseOut={this._forgetValue}
  opacity={0.7}
/>

The data property comes from the properties passed to the Scatterplot component. It needs to have an x and y properties, which is why I transformed our csv file like so. It could also have a size or a color property, but we’re not going to use these in our example.
I’m using an opacity property to better show which marks overlap. I could also have made them smaller, but I’m sticking to the defaults.
Finally, we’re using the onValueMouseOver and onValueMouseOut properties to pass functions to handle what happens when the user is going to, well, mouse over one of the marks, or remove their mouse cursor from them. Those are our private functions from before:

  _rememberValue(value) {
    this.setState({value});
  }

  _forgetValue() {
    this.setState({
      value: null
    });
  }

When a user passes their mouse on a mark, the corresponding datapoint (value) will be passed to the state. And when the user removes their mouse, the value property is reset to null.

finally, right under the MarkSeries component, is where we call our Hint:

  {value ?
    <Hint value={value}>
      <HintContent value={value} />
    </Hint> :
    null
   }

If value (from the state) is worth something, then we create a Hint component. That one comes from react-vis, and handles positioning of the tooltip plus some default content. But I want to control exactly what I show inside my tooltip, so I’ve created a component to do just that.
Creating a specialized component like this is great, because it hides this complexity from the Scatterplot component. All that Scatterplot needs to know is that it’s passing properties to a HintContent component, which returns… something good.

Because of imports and exports, it’s generally a good idea to create such small specialized components.

For the win: the hint content component

import React from 'react';
export default function HintContent({value}) {
  const {birth, country, death} = value;
  return <div>
    <div style={{
      borderBottom: '1px solid #717171',
      fontWeight: 'bold',
      marginBottom: 5,
      paddingBottom: 5,
      textTransform: 'uppercase'
    }}>{country}</div>
    {_hintRow({label: 'Birth Rates', value: birth})},
    {_hintRow({label: 'Death Rates', value: death})}
  </div>;
}

function _hintRow({label, value}) {
  return <div style={{position: 'relative', height: '15px', width: '100%'}}>
    <div style={{position: 'absolute'}}>{label}</div>
    <div style={{position: 'absolute', right: 0}}>{value}</div>
  </div>;
}

The HintComponent is a pure functional component and is our default export.
There’s another function in that module, and we’re not exporting it. In other words, it won’t be accessible by other parts of the app. The only place where it can be used is within this file. Traditionally, those start with an underscore.

The only point of the HintComponent is to offer fine control on the appearance of the tooltip (which also receives styles from index.css). But I wanted to control exactly how the various parts of the data point will appear inside.
So, it has 3 rows. The first one contains the name of the country (well, its 3-letter ISO code). I chose to make it bolder and uppercase. Also, it will have a border separating it from the rest of the card.
The next two rows are similar, which is why I created a function to render them as opposed to just retype it.
It’s a relative div, which takes all the space, with two absolute divs as children. The label one has no position information, so its attached to its top left corner, but the value one has a right attribute of 0, so its attached to its top right corner. So, for each row, the label is going to be left-aligned, and the value, right-aligned.

And that’s it!

For our grand finale, we are going to create a more complex application with several charts that interact with one another…


Beyond rendering

This is the 5th post in my Visualization with React series. Previous post: React components

The lifecycle functions

I’m not going to go into great details on this, but a talk on React without mentioning the lifecycle functions would not be complete.
React components come with several functions which are fired when certain events occur, such as when the component is first created (‘mounts’), when it’s updated or when it’s removed (‘unmounts’).
Pure functional components, which we’ve been mostly using, don’t have lifecycle functions.
But components with a state can have them.

Some examples of usage of those lifecycle functions include:

  • Before the component is rendered, you can load data. that’s a job for ‘componentWillMount’.
  • After a component is rendered, you can animate it, or add an event listener. Use ‘componentDidMount’.
  • Prevent a component from rendering under certain circumstances, even if it receives new properties or its state changes. Use ‘shouldComponentUpdate’.
  • After a component receives new props or new state, you can trigger another function before the component updates (‘componentWillUpdate’) or right after (‘componentDidUpdate’).
  • When a component is going to be removed, you can do some cleanups, like deleting event listeners. Use ‘componentWillUnmount’.

Oftentimes, you can simply get by by using the default behavior of React components, which re-render only when they receive different properties or when their state changes. But it can be really convenient to have that extra degree of control.

Here is an example of using these lifecycle functions in context.

See the Pen lifecycle functions example by Jerome Cukier (@jckr) on CodePen.

What is going on there?
We’re adapting our earlier scatterplot example, only this time, we are not using pure functional components (which don’t have those lifecycle functions), but creating classes.
We’re going to have three classes: Chart, at the highest level; Scatterplot, a child of Chart; and Points.
Chart passes data to Scatterplot. What it passes depends on whether the button is clicked. That button changes the state of Chart (which causes a rerendering of the Scatterplot and the Point elements).
Chart also has a private variable that holds a message we can display on top. We can still use callback functions to change this variable, just like we change the state, but the difference between changing the state and changing a private variable is that changing a private variable doesn’t cause the children to re-render.
When we first create the scatterplot element, the componentDidMount function is called, and the message is changed to reflect that.
Then, each time we click the button, a different data property is passed to the Scatterplot element. Also, the componentDidUpdate method is triggered, which changes the message.
(changing the state of the parent from a componentDidUpdate method can cause an endless re-rendering loop, this is why I used private variables instead of the state, and there are ways to address this but for the sake of brevity this is the easiest way to deal with that problem).
Now, when a full dataset is passed to the Scatterplot element, many Point elements will be created. I’ve also added a lifecycle method to these Points: when they are first created, they receive a small animation. To that end, I have also used the componentDidMount method, but this time at the Point level.
Exit animations are also possible, but – full disclosure – they are less easy to implement in React than entry animations, or than in D3. So again in the interest of concision I’ll skip these for now.

React and D3

We just saw that with React, we can create a DOM element, then immediately after, call a function to do whatever we want, such as manipulating that element. That function would have access to all the properties and state of that React element.
So what prevents us from combining React and D3? Nothing!
We can create components that are, essentially, an SVG element, then use componentDidMount to perform D3 magic on that element.
Here’s an example:

See the Pen mixing react and d3 by Jerome Cukier (@jckr) on CodePen.

In that example, I have used a bona fide bl.ocks (https://bl.ocks.org/mbostock/7881887) and wrapped it inside a React component. So I can create one, or in the case of that example, several such elements by just passing properties. Those components can perfectly function as black boxes: we give them properties, they give us visualizations that correspond to these parameters. And it doesn’t have to be D3 – once a React element has been created, we can use componentDidMount to do all kinds of operations on it.

In the last 2 articles I will present actual data visualization web apps made with React.
In the next post, we’ll see how to set up a simple web app and we’ll create our first example app.


React components

This article is part of my series Visualization with React. Previous article: Coding with React

Using React to create elements out of data is nice, using JSX is hip but until you use your own components, you won’t use React to the fullest.
So let’s do that. Fair warning: that’s the speed bump, especially if you’re not familiar with javascript concepts like ‘this’, which you’re not really required to master with d3.

In the previous examples, we created an element that held a bunch of elements. We are now going to create a custom Point component, to replace our circles. We’re going to do more than just replace it: our new component will be able to do more stuff. Each Point element should remember whether it’s highlighted or not. If it’s highlighted, it will be displayed in red. Else, it will stay in gray. Clicking on a Point will switch its highlighted status.

The way we are going to maintain that highlighted status is by using the state of the component (remember that switch example?).

There are two syntaxes to create components: one uses React.createClass method, and the other uses ES6 classes. I’m providing this next step using both syntaxes. I don’t know which one is more common for the time being, but I feel that the ES6 class one will be in the future, so this is the one I personally use.

See the Pen React scatterplot with custom component – using es6 class by Jerome Cukier (@jckr) on CodePen.

Our custom component is an ES6 class (gasp!) and it’s based on the existing class, React.Component.
So we declare our custom component like this:

class Point extends React.Component {
... a bunch of stuff which is different from React.Component ...
}

Specifically we are going to specify two properties of our new class: constructor and render. Constructor describes what happens when an element of this component is first created, and render is what should be displayed on screen for that element.
Don’t confuse the component and the elements: the component is the type of things that we are going to create, you can think of it as the mold. The elements are what are created with this component, think of it as casts. Creating the component describes how the elements should be created. Later in the code, we are going to create, or instantiate, the individual elements using the component. In Javascript, as in many other languages, by convention, classes like our component have a name that starts with an upper case.

So let’s look at the first property.

constructor(props) {
super(props);
this.state = {highlighted: false};
}

what’s the argument of constructor, props? In React world, props is short for properties. Until now, we never really had to manipulate properties inside the component.
In this specific example, we don’t really do anything with props, so we could write just constructor() {…}. But it’s a convention, and if at some point we want to do something with these properties right when the component is first created, we might.
The second line is super(props). What this does is that it passes whatever arguments the constructor had to the constructor of the original React.Component class. You don’t have to know what happens then, just that it’s a mandatory step.
The third line introduces us to the state. we assign an object to “this.state”.
But what is this? the 10000 ft view is that it refers to a specific context or scope (the article under the link above is fantastic if you want to know more).
We’re going to have many Point elements. Each of them can be highlighted or not. Each of them also corresponds to a different data point. Each of them can access and manipulate data that no other can. This is where this comes from. Properties of this (that is, whatever comes after “this.”) are going to be private to that element, in other words, not accessible from the outside.
And there are going to be two very important properties: props and state.

this.props are the properties of the element, which the element cannot change. They come from its parent element.
this.state is the state of the element, which the element can change: and when it does, the element will be re-rendered.

Speaking of rendering, let’s look at the next property of our class: the render method.
That method must render a React element or null.

So:

render() {
  return <circle
  onClick = {
    this.setState({
      highlighted: !this.state.highlighted
    });
  }}
  r = {
    5
  }
  style = {
    {
      fill: this.state.highlighted ? 'red' : '#222',
      opacity: 0.2,
      transition: 'fill .5s'
    }
  }
  />;
}

Our component will create a element. But it could also be another custom component! Let’s just keep it simple for now.
cx, this time, will be expressed as a calculation based on this.props.birth. (and likewise cy will be computed from this.props.death).
birth and death are the properties that will have to be passed to the component to create an element (which we’ll see in the end).

we have a new property: onClick. onClick, unsurprisingly, handles click events. So when a user clicks, that will trigger a function which will do the following:

this.setState({
highlighted: !this.state.highlighted
});

The intention here is to assign to the highlighted property of the state the value which is opposite to that it currently holds. That value is stored at this.state.highlighted. Remember that originally, we stored {highlighted: false} in this.state, so this.state.highlighted is where it’s at. And so, !this.state.highlighted is the opposite of the current highlighted status.
this.setState adds the relevant property to the state. So, this construct effectively reverses the value of this.state.highlighted.
Whenever the state changes, the component is automatically re-rendered without any other action required (we can prevent that if needed, but we’ll see that later).

Finally, let’s look at what’s happening towards the end, with our style.
As we’ve seen several times before, we pass an object to style. Because of the JSX notation, that’s two sets of curly braces.
The fill property of the style depends on the state. So, if highlighted is true, it’s going to be red, else it’s going to be gray. Just as we said.
I’m also adding to the style a transition property, so that instead of just blinking from red to gray, our component smoothly fades from one color into the other.

So that’s our class.
The second part of the code is the same with both syntaxes, so let’s see how we create a component using React.createClass.

See the Pen React scatterplot with custom component – using createClass by Jerome Cukier (@jckr) on CodePen.

So instead of creating a class, we create a variable:

const Point = React.createClass({
... object with properties ...
});

So this time, we pass to React.createClass an object that describes the component that we’re going to create.
As above, we care about two things: that the elements it creates have a state, which starts as not highlighted, and how they should be rendered.
When we use React.createClass, the way to initialize a state is to use a property called getInitialState.
You have to assign to that property a function that returns an object: that object is the initial state.

...
getInitialState: function getInitialState() {
return {highlighted: false};
},
...

A word of caution: React.createClass takes an object as an argument, so its properties are separated by commas. There are no commas between the properties of a class, with the first syntax.

The second property of our object is render. Render gets a function that will output a React element or null. The syntax is very close to the above.
getInitialState, like render, are called lifecycle methods. This is because they are called at specific moments of the life of our component. There are more than 2, and they are one of the most interesting parts of React. We’ll cover them in our next article.

Now let’s look at the second part of our code. Now that we’ve got a custom component, what of it?
well, let’s use it to create elements!

const svg = <svg height={300} width={300}>{
 birthdeathrates.map(d => <Point birth={d.birth} death={d.death} />)
}</svg>;

What’s different here is that line with the element.
Remember that before, we created a element and we specified its cx and cy properties. This time, we don’t pass cx or cy, instead we just pass a value for birth and a value for death. The component can do the rest!

Pure functional components

Our Point component is somewhat complicated because we maintain its state. Because we care about its state, we need to initialize it, we need to capture events that could affect it, and have our output depend on it.
By contrast, if all we had were properties (which, again, do not change), what the component does could be much simpler: it takes an input, and produces an output. The same input produces the same output. Just like each time when you add two numbers, the result is the same if the numbers you add are the same.
In javascript terms, if you had a function that didn’t use global variables, randomness or external APIs, when you pass the same argument to that function, you get the same result. This is what’s called a pure function. Pure functions have a lot of good things going for them, not least their stability and predictability and simplicity.
So let’s suppose we didn’t care about the state of our Point component.
React let us write it as a pure functional component.
Here’s how:

See the Pen React scatterplot with pure functional component by Jerome Cukier (@jckr) on CodePen.

function Point({
  birth,
  death
}) {
  return <circle
  cx = {
    birth * 10
  }
  cy = {
    300 - death * 10
  }
  r = {
    5
  }
  style = {
    {
      fill: '#222',
      opacity: 0.2
    }
  }
  />;
}

Our component is now just a function! we pass it an object with properties {birth, death} and you can use them directly in the body of the function. No need for this.props.birth or whatever.
The second part of the code doesn’t change, the elements are still created exactly the same way.

Combining components: I’ll call you back

In a real world situation, you’ll probably have many custom components being parts of one another and passing data back and forth.
So, let’s step up in complexity.
Let’s use the same dataset, but this time we’ll make a bar chart.
Initially, we’ll show birth rates. But we’ll also add a switch! and if the user touches the switch, we’ll show death rates instead.
So. Let’s think this through a little bit.

We’ll have a Chart component that is going to be at the top level.
That component will have a Switch component as a child.
It will also have several Bar components that will correspond to the actual data. We can make the Bar components out of our birthdeathrates dataset as before.

<Chart>
  <Switch />
  <Bar />
  <Bar />
  <Bar />
  ...
</Chart>

There will be an event attached to the switch, so that when it’s clicked, the Bars can change.
Now the real question is: which component’s state should be changed by the switch?

We’ve seen how the switch could change its own state. But the Bar components wouldn’t be able to read it.
Ideally, the switch will trigger some kind of change in the Bar component, but likewise, it cannot reach the state of those.

So: we’ll have to find a way to get our switch to update the state of the Chart component. When the state of Chart updates, it re-renders. That means that it can pass new properties to its children. It can tell its Bars to use the death property instead of the birth one.
But how to access the state of the parent from one of its children? That’s possible using callback functions.

If we are within the parent element, we can access its state.
So, we could create a function that would do:

updateMetric(metric) {
  this.setState({metric}); // this.setState({metric: metric}) in short hand notation, possible with babel
}

That function would work within our future Chart component. Now what if… we passed that function to Switch as a property? then, when executed, it would change the state within Chart. That would trigger a re-render, and Chart could pass different props to all of its children.

Let’s make it work.

See the Pen React bar chart with callback by Jerome Cukier (@jckr) on CodePen.

Lots of stuff going on here!

class Chart extends React.Component {
   constructor(props) {
     super(props);
        
     this.state = {
       metric: 'birth',
     };
   }
// ...

This is the constructor of our class. We’ve seen it before, the only special thing is that we give it an initial start here by giving a value to this.state.

render() {
    const metric = this.state.metric;
    const data = this.props.data.sort((a,b) => b[metric] - a[metric])
      .map((d, i) => ({...d, rank: i}))
      .sort((a, b) => b.country > a.country);

Here, metric gets the value of whatever we put in the state.
And data is: whatever is passed to the props as data, first sorted by the value of the corresponding metric, then given a rank property which is just its order in that sorted list, and finally sorted alphabetically. So whatever the metric, the same country will always be at the same position in this array, only its rank property, which was computed while the list was sorted, would be different.

    return <div className='chart'>
      {[
       <span className='label'>Birth rate</span>,
       <Switch metric={metric} updateMetric={(d) =>
            this.setState({metric: d})
       }/>,
       <span className='label'>Death rate</span>,
       <div>
         {data.map(d => 
          <Bar country={d.country} value={d[metric]} rank={d.rank}/>
         )}
      </div>
      ]}
    </div>; 

Nothing that we’ve never seen before in that render function – we’re just creating divs or instances of components that remain to be described, and we pass them props. The only new thing is that updateMetric property of Switch. Instead of passing a value or an array, we pass a function. And in that function, we call this.setState.
Because we are still within the Chart component, this.setState will change the state of a Chart component. But wait: we are actually passing that function to another component, Switch! This component, a child of Chart, receives a function that lets it change the state of its parent.
That’s the callback function.

Here’s that Switch component:

function Switch({metric, updateMetric}) {
  return <div className = 'switch__track'
     onClick = {() => updateMetric(metric === 'birth' ? 'death' : 'birth')}
    >
      <div className = {'switch__thumb ' + metric} />
    </div>
};

Switch doesn’t have a state of its own, so we can just use a functional component. Switch receives updateMetric as a property. Switch doesn’t know anything about this function – it doesn’t have to. It doesn’t need to know that this function will affect its parent. All it does is launch this function when it’s being clicked – that’s what the line with onClick does.

Here’s another example presented without comments with similar data, with a slightly different ways to order the components.
This time, the top level component is Dashboard, which has 2 Chart components, which each have several Bar components as children. Mousing over Bar components updates the state of the Dashboard components, which re-renders its Charts children and their Bar children.

See the Pen react dual bar chart by Jerome Cukier (@jckr) on CodePen.


Coding with React

This article is part of my series Visualization with React. Previous article: An ES6 primer

Setting things up in Codepen

In the last two articles of the series, I’ll cover how to get a real React coding environment going, but to start dabbling, playgrounds like jsFiddle or codepen are great. I’m partial to codepen. When you create a new pen, you still have a couple of options to set up before you can start creating React code:

In the Settings / Javascript / quick-add section (the drop-down at the bottom left) please choose React, then React DOM.

All of the code examples of articles 1, 3, 4, and 5 can be found in this codepen collection.

Creating elements

See the Pen React simple scatterplot by Jerome Cukier (@jckr) on CodePen.

In this first React example, we’re going to create a couple of very simple elements and render them. Let’s start by the end: ReactDOM.render(myDiv, document.querySelector('#root')); We use ReactDOM.render to, well, render something we have created (myDiv) somewhere in our document (on top of what corresponds to the ‘#root’ selection. We conveniently have a div with the id “root” in the HTML part of the pen). That’s it! we’ve output something using React. While the syntax can appear a bit daunting, it really does one simple thing: take what you’ve made and put it where it should be. But what’s that myDiv? To find out, let’s look at the first 2 lines of our code. const mySpan = React.createElement('span', {style: {fontFamily: 'sans-serif'}}, 'hello React world'); const myDiv = React.createElement('div', {className: 'my-div'}, mySpan); Oh, so before there was a myDiv, there was a mySpan. MySpan is a React element, the building brick of the React eco system. To create it, we use React.createElement which is the workhorse of React. React.createElement takes three arguments: the type of React element we are creating, its properties, and its content. The type of element can be any HTML or SVG element, and we’ll see later that we can also make our own. The second argument is the properties. It’s an object. In the d3 world, the properties could be what goes in the attr method. So when you create an SVG element like a rect, its properties could include things like x, y, width and height. In d3, style is treated slightly differently. This is also the case in React. When using React.createElement with an HTML or SVG element, that could be styled using CSS, you can use a style property to pass a style object. That style object contains all CSS properties you want to apply to the object, but instead of hyphenating them, they are written in camel case (so font-family, for instance, becomes fontFamily). The third argument is content: it can either be a string, a single React element, or an array of React elements. In the first line (mySpan) we’ve used a string. So, this first line created a React element which is a span, which contains “hello React world”, and which has a simple style applied to it. In the second line, we create a second React element. Again, React.createElement takes three arguments: type of element (now it’s an HTML div), properties and content. Instead of providing a string, we can pass another React element, such as mySpan that we created above. And that’s it! we’ve rendered something using react.

Creating elements from data

In the example above, we’ve used React.createElement with two kind of content: a string and another React element. But I mentioned that there was a third possibility: an array of React elements. If you’re familiar with d3, you might think: in d3, I could do that from an array of data. The idea in React is pretty similar, only, instead of using select / selectAll / data / enter / append, we can just create our array.

See the Pen React simple scatterplot by Jerome Cukier (@jckr) on CodePen.

One simple way to do that is to use map: myArray.map(d => React.createElement(...)). This is exactly what we are doing in the snippet of code above. This uses the birthdeathrates dataset, one of the example files provided with R (number of births and deaths per thousand people per year in various countries.) The interestingness happens here:

birthdeathrates.map(
  (d, i) => React.createElement('div', {
    'key': i,
    'style': {
       background: '#222',
       borderRadius: 5,
       height: 10,
       left: 5 * d.birth,
       top: 300 - 5 * d.death,
       position: 'absolute',
       width: 10,
       opacity: .2}
  })
)

In the properties that I pass, some depend on the underlying data. This is a mapping so it’s going to return something for each item of the array. Each item of the array is represented by d, and has the birth, death and country properties. In left and top, we use a calculation based on these properties. And for each item, we get a React element created with these calculations. This isn’t unlike what we’d had in d3 if we had written:

 ...
 .selectAll('div')
 .data(birthdeathrates)
 .enter()
 .append('div')
 .style({ ..., left: d => 5 * d.birth, top: d => 300 - 5 * d.death, ...})

Take note of the key property in the react code. This is necessary when you create many elements using map (well not really necessary but strongly recommended, you’d get a warning if you don’t use it). This is used so that if for some reason your parent element has to re-render, each child element will only be re-rendered if needed. If you’ve followed this far, you are now capable of doing things in React the critical part of what you were doing with d3: creating elements out of data. You might wonder: but does it work for svg? yes, and the logic is exactly the same:

See the Pen React simple scatterplot by Jerome Cukier (@jckr) on CodePen.

Introducing JSX

See the Pen React simple scatterplot JSX by Jerome Cukier (@jckr) on CodePen.

At this point you might think: all of this is great, but typing React.createElement all the time is kind of cumbersome. Many people do too, and there are a number of ways to not do that. The most popular, and the one in use at Facebook, is JSX. I personally use r-dom most of the time, but since JSX is definitely the most common way to write React, now that you have a feel for what React.createElement does, it’s not unreasonable to continue with JSX.

The main idea of JSX is that you’ll write tags in your javascript. Instead of writing:

React.createElement('type', {property1: value1, property2: value2, ...}, content)

you would write:

<type property1={value1} property2={value2} ...>
content
</type>

So in our previous example, we create an SVG element that has a width and a height property.
We’d write:

const svg = <svg height={300} width={300}>
//... content ...
</svg>

Inside the opening tag, we list all the properties and we give them a value. This isn’t unlike what you’d see when you watch the source of an HTML file.
The value of the properties go inside curly braces, unless they are a string. For length-type values (ie height, width, top, left, font-size…) if a number is provided, it’s assumed it’s in px.
If the element we create has other elements inside of it, there has to be an opening and a closing tag (ie <element> and </element>). But if there isn’t, there can be a single tag (ie <element />)
Inside our svg, we have a bunch of circle elements. They are of the form:

<circle 
  cx={5 * d.birth}
  cy={300 - 5 * d.death}
  key={i}
  r={5}
  style={{
    fill: '#222',
    opacity: .2
  }}
/>

inside our curly braces, we can have calculations. And since there are no elements inside our circles, we don’t have to have both a <cirlce> and a </circle> tag, although we could; we can have a single <circle /> tag.

That’s it in a nutshell, more details can be found here.
Now you might think: if I type that in my text editor, I’m almost certain I’ll get an error! Indeed, behind the scenes, there has to be some transformation for your browser to understand JSX. This magical operation is called transpilation. Transpilation is just what you’d hope it is, it turns code written how you like into code that the browser can interpret flawlessly. The flip side is that… well, you have to transpile your code.
If you work into environments like codepen or JsFiddle, they can take care of this for you. The most common transpiler is Babel. Babel turns your code into ES2015 compliant javascript (that is, before ES6). So the added bonus is that we can use any ES6 feature without wondering whether the user browser supports it or not. Most ES6 features are supported by the latest versions of many browswers, but there’s no guarantee that your users will run your favorite browser, let alone its latest version.
If you want to do this on your own, you’ll have to set up a build environment, we’ll cover this in the last two articles.


An ES6 primer

This article is part of my series Visualization with React. Previous article: React and D3 – similarities and differences

In this guide, I will use ES6 notation whenever I would normally do it in my day job. There are many, many differences in ES6 compared to previous versions of javascript and that can be daunting. But in this time and age, a lot of code you can run into is going to be written in ES6, so a cursory knowledge of some of its features can go a long way.
Here are the features I use most often:

Fat arrows functions

ES6 introduces a new, more concise way to write functions. Instead of writing:

function add10(d) {return d + 10;}

one can write:

var add10 = d => d + 10

Technically, those two forms are not completely equivalent. The main difference is if you need to use the context keyword this. But in most cases, fat arrows are a much more concise, and therefore more legible syntax.

To do a function which takes more than 1 argument, wrap them in parentheses like so:

(a, b) => a + b

For a function with several statements, you must use curly braces like a regular function, and use return if needs be:

d => {
  console.log(d);
  return d;
}

For a function that returns an object, wrap that object in parentheses to avoid confusing it with the previous form:

d => ({key: d})

const and let

Before ES6, to declare variables, you could only use the var keyword.

var a;
var b = 10;

In ES6, you can declare variables using const or let. When you use const, the variable cannot be reassigned:

 const a; // error - a must be assigned a value 
 const b = 1;
b = 2; // error - b can no longer be reassigned

Variables declared with let can be reassigned.

 let a; // ok
a = 10; // ok
a = 20; // still no error

const and let are more expressive than var, because they specify whether we plan to change the value of a variable or not. They have another advantage: they are scoped. They can be used inside of an if branch, or a for loop, and not be accessible outside of it. Conversely, var are not scoped – they are available everywhere within the function where they are declared, or globally if declared outside of a function.
So, there’s no reason to ever use the var keyword in ES6.

Spread operator

In ES6,if you have an array inside another array, you can replace that array with its items in sequence using the spread operator. An example would make this clearer:

const a = [1, ...[2, 3, 4]]; // [1, 2, 3, 4].

That may seem like not much but it’s super versatile and useful. For instance, instead of concatenating two arrays, you can write:

const a = [1, 2];
const b = [3, 4]
const c = [...a, ...b]; // [1, 2, 3, 4]

Interestingly, it works with empty arrays:

 
const a = [1, 2];
const b = [];
const c = [...a, ...b]; // [1, 2]

But not with primitive literals (numbers, etc)

const a = [1, 2];
const b = 3;
const c = [...a, ...b]; // error

Instead of pushing an item to the end of an array, you can also use the spread operator:

const a = [1, 2];
const b = 3;
const c = [...a, b]; // added benefit - creates a new array instead of changing it in place.

Note the difference between these 2.
[…[1,2], 3] will work;
[…[1, 2], …3] will not.

Composing arrays like this can be conditional!

const a = [1, 2];
const b = 3;
const condition = false;
const c = [...a, ...(condition ? [b] : [])] // [1, 2];

What just happened? just like above, but we applied the spread operator to the expression which is in parentheses. If the condition were true, that expression would be equivalent to [b]. But since it’s false, it is equivalent to an empty array.

An experimental feature of ES7 extends the spread operator to objects.

const obj = {key: 'a'};
const newObj = {...obj, value: 1}; // {key: 'a', value: 1}

Destructuring assignment

You can do more stuff with objects in ES6. Destructuring assignment covers a number of nifty features but here are the two I use the most.

const obj = {key: 'a', value: 123};
// you can read several properties from an object at once and assign them to variables:
const {key, value} = obj;
console.log(key, value); // 'a', 123

Before ES6, you had to write a function like this:

function div(num, den) {return num / den;}
div(6, 2); // 3;
div(2, 6); // 0.333333 order of the parameters matters!
div(3); // NaN - can't forget an argument! 

In ES6, we can expect the function as argument to take an object and access its properties:

function div({num, den = 1}) {return num / den;}
div({num: 6, den: 2}); // 3
div({den: 2, num: 6}); // still 3
div({num: 3}); // still 3 - den has a default value

Using an object, we don’t have to remember in what order the function parameters have to be provided.

Wrapping it all together

what’s another form for the last function I wrote?

const div = ({num, den = 1}) => num / den;

In the next article in the series, Coding with React, we will finally start to write some React code.


D3 and React – similarities and differences


Previous article: Visualization with React

d3, meet cousin React

Let’s not sugarcoat it: working with React is more complicated than with plain vanilla javascript. There are a few additional notions which may sound complex. But the good news is that if you come from the d3 world, there are many concepts which are similar. Visualization on the web is, at its core, transforming a dataset into a representation. That dataset is probably going to be an array, and at some point the framework will loop through the array and create something for each element of the array. For instance, if you want to make a bar chart, you probably will have at some point an array with one item that corresponds to each bar, which has a value that corresponds to its length. Looping through the array, each item is turned into a rectangle whose height depends on that value. That logic, which is at the core of d3 with selections, is also present in React. In d3, visualizations are essentially hierarchical. We start from an SVG element (probably), add to it elements like groups, which can hold other elements. To continue with our bar chart example, our chart will have several data marks attached to it (the bars), and there’s a hierarchical relation between them: the chart contains those marks. Our chart could be part of a dashboard that has several charts, or part of a web page that has other information. At any rate, in the d3 world, everything we create is added to a root element or to elements we create and arranged in a tree-like hierarchy. This is also the case in React, with a difference: the world of React is mostly structured into components. When that of d3 is mostly made of DOM elements like HTML or SVG elements, that of React is made of components. A React component is a part of your end result. It can be as small as a DOM element, or as big as the whole application. And it can have component children. So, components are logical ways to package your application. Components are created with modularity and reusability in mind. For instance, I can create a bar chart component in React, and the next time I have a bar chart to make, I can just reuse the exact same component. I can also create components to make axes or the individual bars in the chart, which my bar chart component will use. But the next time I need a bar chart, I wouldn’t have to think about it. In contrast, if I want to create another bar chart in d3, I probably have to recreate it from scratch and decide manually what happens to all the SVG or HTML elements that constitute the bar chart.

You say dAYta, I say da-tah

One fundamental way in which d3 and React differ is by how they treat data. If you read about React, you may find fancy terms like one-way data binding. In how many ways the data is bound in d3 is not something which is on top of our head when we create visualization so that might sound confusing. In d3, an element can modify the data which is associated to it. I’ve used it so many times.

See the Pen React simple scatterplot by Jerome Cukier (@jckr) on CodePen.

These bars have been made with a very simple dataset shown below them. If you click on the bars, the underlying data will change and the representation will change as well. In the world of React, when properties are passed to a component, they cannot be changed. That’s what one-way binding means. Data in React flows unidirectionally. Once it’s defined, it determines the way all components should be displayed. In certain events, a parent component can pass different properties to its children component and they may be re-rendered (we’ll see this in just a moment). But the important part is that properties passed to a component can never be changed. You may wonder: why is that even a good thing? React makes it impossible to do things! yes, but in the process it also makes things much safer. If properties can’t be changed, it also means that they can’t be altered by something we hadn’t thought of. Also, it makes it much easier to work on components independently: one team mate could make a bar chart component while her colleague makes a line chart. They don’t really need to know the inner working of the other component, and they know that nothing unexpected will disturb the way their component function.

The state of affairs

Components of React have a really powerful feature which doesn’t explicitly exist in d3: the state. The state represents the current status of a component. Here’s a simple switch component:

See the Pen React simple scatterplot by Jerome Cukier (@jckr) on CodePen.

We want to record the fact that the switch can be turned on or off. Here’s how it should work: First we create our switch component, and it’s supposed to be off. Then, if the user clicks it, it becomes on if it were off and vice-versa. And it should also be redrawn, to reflect that it’s been turned on (or off). The state does all that. It records the current status of the component. Technically, it’s an object with properties, so it can save a lot of information, not just a simple true or false value. The other great thing about the state is that if it changes, then the component is re-rendered. Rendering a component could require rendering children component, and they may be re-rendered as well. So with the state and properties, we have a powerful framework to handle events and whatever may happen to our app. If there’s an event we care about, it can change the state of a component, then, all of the children components may be re-rendered. And there’s no other way to redraw them. This is in contrast with plain d3 where anything goes – anything can change anything, data can be used to render elements, the underlying data can be changed without changing the element, the element can be transformed without changing the underlying data.

State is an important notion in computer science. In d3, it’s just doesn’t have a more formal representation than all the variables in your code.

In the next article in the series, an ES6 Primer, we will look in some useful ES6 features for React.


Visualization with React

Some back story…

In what seemed a lifetime ago now, I wrote tutorials to help people get started with Protovis as I learned it myself (it is indeed a lifetime away since Protovis is dead and buried for all intents and purposes). And a few years ago, I did the same for d3 as this started to become the most powerful visualization framework and for which documentation was still scarce. I wrote these tutorials to help me learn, but since then I have met many people who found them useful which blew my mind. By documenting my learning, I got noticed by Facebook and travelled 9000 miles to a new life.

At Facebook, I had some loosely-defined data visualization explorer role. While I joined during the infancy of React, I didn’t feel super comfortable using it then – I felt more effective writing one-off d3 applications. Eventually, I moved on and am now working at Uber as a fully-fledged data visualization engineer. I work almost exclusively with dashboards, which have a pretty elaborate UI.

Like in many other companies, at Uber, we use React for our web applications, including our visualizations, dashboards and maps. Increasingly, React is becoming the lingua franca of visualization: more than a tool that allows one to draw data, a mindset that informs how one should think a visualization. React is no longer a young library – the initial public release dates back from May 2013, and its very first application at Facebook was visualization (my first Facebook project, pages insights). There’s already many, many learning resources and tutorials for React. What I’ll try to do here is to show how React can be used for visualization: hopefully, this will be useful both for people who come from d3 and who’ve never worked with a web framework before, and for people who are familiar with React but who don’t know visualization well. That won’t be a complete and exhaustive guide, more a way to get started with references on how to go further.

The articles

I’ve structured this guide in 7 parts, and I’ll publish one per day:

  1. React vs D3, where we’ll explore similarities and differences between these two frameworks.
  2. An ES6 primer. I have written all the examples in good, sensible, modern ES6 javascript, because as of 2016 this is probably the most common syntax. Without going too deep into the details, I’ll explain what parts of the language I used for the examples, and how they differ from ES5.
  3. Gentle introduction to coding with React, where we’ll explore the high-level concepts of the framework and see how we can create visual elements from data. We’ll end on a presentation of JSX, a flavor of Javascript used to write React applications, which I’ll also use for most of the examples for the same reasons as ES6 – because it’s the most widespread way of writing React code today.
  4. React components, the most important concept in React and the building blocks of React applications.
  5. Beyond rendering. We’ll look at the React concept of lifecycle methods, and also how we can use d3 within React components.
  6. Creating a React visualization web app – using what we’ve seen, and two libraries – Facebook’s create-react-app and Uber’s React-vis, we’ll create a small standalone React visualization that can be deployed on its own website.
  7. The big leagues – in that last part, we’ll write together a more complex visualization with live data and several components interacting with one another.

The code

The examples of parts 1-5 can be found on codepen. I’ll add link to examples of part 6 and 7 when they go live.


You may not need d3

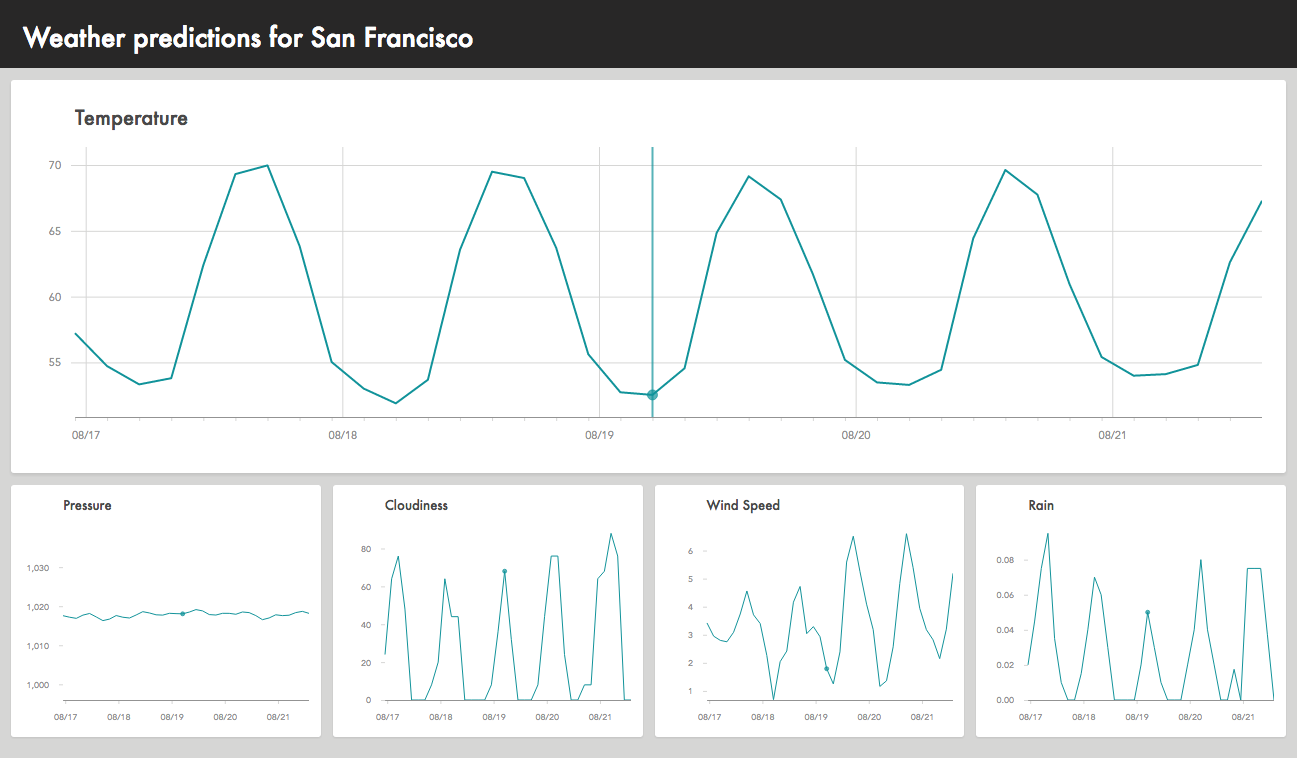
If you’re working on visualization on the web, the go-to choice is to use d3js (or a higher-level library). d3js is powerful and versatile. The best proof of that is the lead author of d3, Mike Bostock, worked until recently at the New York Times which many, including myself, consider the ultimate reference in terms of information graphics. At the NYT and elsewhere, d3js has powered breathtaking projects.

d3js was built as a successor to protovis. Protovis was a slightly higher-level library than d3js, more specialized in data graphics, and designed with the assumption that it could be used with little or no programming experience. And indeed this was true. When I started using protovis in 2009, my javascript skills were limited, and so I learned by deconstructing and recombining the examples. I kept on doing that when d3 came along – learning through examples. And the d3 examples, like those in protovis before, were short and standalone, demonstrating how easy it was to create something with a few lines of code.

d3js requires more technical knowledge than protovis did to get started, but not much. However, it is much more versatile – no longer constrained to charts and maps, it can handle a lot of the front-end functionalities of a web site. And so, it is possible to make visualizations by:

  • learning how to do stuff in d3js,
  • learning the essential javascript that you need to run d3js, as needed (i.e. variables, if-then statements, array methods…)
  • then, learning through doing, and obtain a feeling for how SVG, HTML and the Document Object Model works.

This approach is actually very limiting.

You would create much more robust code by:

  • learning javascript,
  • learning SVG/HTML/DOM,
  • then learning and appreciate d3 logic.

That would give you the choice when to use a d3js method, when to use another library (past, present or future), or when to use native javascript.

The point of this article is to go through the main functions of d3js and see how they can be replicated without using a library. As of this writing, I am convinced that using d3js is the most sensible way to handle certain tasks (though this may change in the future). In almost any case I can think of, even when it’s not the most efficient way to do so, using the d3js approach is the most convenient and the easiest from the developer’s perspective.  But I also believe it’s really important to know how to do all these things without d3js.

This will be a very long post. I’m trying to keep it as structured as possible so you can jump to the right section and keep it as a reference. This also assumes you have a certain familiarity with d3js and javascript – this is not an introductory post.

I’ve divided it in 4 parts:

  • Tasks that you really don’t need d3js for. And ok, you may want to use it regardless. But here’s how to do those things without it. (manipulating DOM elements)
  • interlude: a reflexion on d3js data binding. Do you really need that?
  • Tasks which are significantly easier with d3js (working with external data, animation)
  • Tasks where as of now, d3js is clearly superior to anything else (scales, array refactoring, map projections, layouts).

Selecting and manipulating elements

At the core of d3js is the notion of selection. In d3js, you select one or several elements which become a selection object. You can then do a variety of things:

  • join them with data, which is also an essential tenet of the d3 philosophy,
  • create or delete elements, especially in relation to the data you may have joined with their parent,
  • manipulate these elements by changing their attributes and their style, including in function of the data joined with each of them,
  • attach events listeners to those elements, so that when events happen (ie somebody clicks on a rectangle, or change the value of a form) a function might be triggered,
  • animate and transform those elements.

Selecting elements and parsing the DOM

d3 selection objects vs Nodes, HTML NodeList vs HTML LiveCollections

When you select something with d3js, using methods such as d3.select() or d3.selectAll(), this returns a d3 selection object. The selection object is a subclass of the javascript object Array – check here for all the nitty-gritty. The gist of it is that d3 selection objects can then be manipulated by d3 methods, such as .attr() or .style() to assign attributes or styles.

By contrast, the DOM is made of Node objects. The root of the DOM, the Document Object Model, is a special Node called Document. Nodes are organized in a tree-like structure: Document has children, which may have children etc. and encompass everything in the page. The Node objects are really the building blocks of a web page. When an element is added, be it an HTML element like a <div> or an SVG element like a <rect>, a new Node is created as well. So d3js has to interact with Node objects as well. d3 selection objects are tightly connected to their corresponding Node objects.

However, with “vanilla” javascript, you can directly access and manipulate the Node objects.

d3.select / d3.selectAll vs document.querySelector / document.querySelectorAll

In d3js, you parse the document using d3.select (to select one object) or d3.selectAll. The argument of this method is a CSS3 selector, that is, a string which is very similar to what could be found in a CSS style sheet to assign specific styles to certain situations. For instance, “g.series rect.mark” will match with all the rectangles of the class “mark” which are descendants of the SVG g groups of the class series.

When d3js was introduced in 2011, javascript didn’t have an equivalent syntax – instead you could select elements by class, or by id, or by tag name (more on that in a minute). Things have changed however and it is now possible to use CSS3 selectors using document.querySelector (which will return just one node) or document.querySelectorAll (which will return an HTML NodeList).

An HTML NodeList is a special object which is kind of like an array of Node objects, only it has almost no array methods or properties. You can still access its members using brackets, and get its length, but that’s it.

I wrote document.querySelectorAll, because you can use this method from the document, but you can use it from any Node. Those two snippets of code are parallel:

var svg = d3.select("svg"); // svg is a d3 selection object
var g = svg.selectAll("g"); // g is a d3 selection object
var svg = document.querySelector("svg"); // svg is a Node
var g = svg.querySelectorAll("g"); // g is a NodeList

 Getting elements by class name, ID, tag name, name attribute

d3js doesn’t have a special way to get all descendants of a selection of a certain class, of a certain ID, etc. The CSS3 selector syntax can indeed handle all those cases, so why have a separate way?

By contrast, javascript pre-2011 didn’t have a querySelectorAll method, and so the only way to parse the document was to use more specific method, like document.getElementsByClassName().

document.getElementsByClassName() retrieves all descendants of a certain class. document.getElementsByName() retrieves elements with a certain “name” attribute (think forms). documents.getElementsByTagName() gets all descendants of a certain type (ie all <div>s, all <rect>s, etc.).

What’s interesting about that is that what is returned is not an HTML NodeList like above with querySelectorAll, but another object called HTML Live Collection. The difference is that matching elements are created after, they would still be included in the Live Collection.

var svg = d3.select("svg");
svg.selectAll("rect").data([1,2,3]).enter().append("rect");
var mySelection = svg.selectAll("rect"); // 3 elements
mySelection[0].length // 3
svg.append("rect");
mySelection[0].length // 3
mySelection = svg.selectAll("rect"); // re-selecting to update it
mySelection[0].length // 4
var svg = document.querySelector("svg");
var ns = "http://www.w3.org/2000/svg";
var i;
for (i = 0; i < 3; i++) {
  var rect = document.createElementNS(ns, "rect"); // we'll explain creating elements later
  svg.appendChild(rect);
}
var mySelection = svg.getElementsByTagName("rect"); // 3 elements
var rect = document.createElementNS(ns, "rect");
svg.appendChild(rect);
mySelection.length // 4 - no need to reselect to update

How about IDs? there is also the getElementById (no s at elements!) which only retrieve one element. After all, IDs are supposed to be unique! if no elements match, getElementById returns null.

Children, parents, siblings…

Truth be told, if you can use selectors from the root, you can access everything. But sometimes, it’s nice to be able to go from one node to its parents or its children or its siblings, and d3js doesn’t provide that. By contrast, the Node object has an interface that does just that – node.childNodes gets a nodeList of child nodes, node.parentNode gets the parent node, node.nextSibling and node.previousSibling get the next and previous siblings. Nice.

However, most often you will really be manipulating elements (more on that in a second) and not nodes. What’s the difference? all Elements are Nodes, but the reverse is not true. One common example of Node which is not an Element is text content.

To get an Element’s children, you can use the (wait for it) children property. The added benefit is that what you get through children is a LiveCollection (dynamic), while what you get through childNodes is a NodeList (static).

var svg = document.querySelector("svg");
var ns = "http://www.w3.org/2000/svg";
var i;
for (i = 0; i < 3; i++) {
  var myRect = document.createElementNS(ns, "rect"); // we'll explain creating elements later
  svg.appendChild(rect);
}
// the variable myRect holds the last of the 3 <rect> elements that have been added
svg.childNodes; // a NodeList
myRect.parentNode; // the svg element
myRect.nextSibling; // null - myRect holds the last child of svg.
myRect.previousSibling; // the 2nd <rect> element
svg.firstChild; // the 1st <rect>. Really useful shorthand
svg.querySelector("rect"); // also the 1st <rect>.
svg.children; // a LiveCollection

Adding/reading attributes, styles, properties and events

Node, Element, EventTarget and other objects

In d3 101, right after you’ve created elements (to which we’ll come in a moment), you can start moving them around or giving them cool colors like “steelblue” by using the .attr and .style methods.

Wouldn’t that be cool if we could do the same to Node objects in vanilla javascript!

Well, we can. Technically, you can’t add style or attributes to Node objects proper, but to Element objects. The Element object inherits from the Node objects and is used to store these properties. There is also an HTMLElement and SVGElement which inherit from the Element object.

If you look at the Chrome console at an SVG element like a rect, you can see, in the properties tab, all the objects it inherits from: Object, EventTarget, Node, Element, SVGElement, SVGGraphicsElement, SVGGeometryElement, SVGRectElement, rect.

All have different roles. To simplify: Node relates to their relative place in the document hierarchy, EventTarget, to events, and Element and its children, to attributes, style and the like. The various SVG-prefixed objects all implement specific methods and properties. When we select a Node object as we’ve done above with svg.querySelector(“rect”) and the like, note that there’s not a Node object on one side, then an Element object somewhere else, a distinct SVGGeometryElement, and so on and so forth. What is retrieved is one single object that inherits all methods and properties of Nodes, Elements, EventTargets, and so on and so forth, and, as such, that behaves like a Node, like an Element, etc.

Setting and getting attributes

You can set attributes with the Element.setAttribute method.

var rect = document.querySelector("rect");
rect.setAttribute("x", 100);
rect.setAttribute("y", 100);
rect.setAttribute("width", 100);
rect.setAttribute("height", 100);

To be honest, I’m a big fan of the shorthand method in d3js,

var rect = d3.select("rect");
rect.attr({x: 100, y: 100, width: 100, height: 100});

Also, the Element.setAttribute method doesn’t return anything, which means it can’t be chained (which may or may not be a bad thing, though it’s definitely a change for d3js users). It’s not possible to set several attributes in one go either, although one could create a custom function, or, for the daring, extend the Element object for that.

Likewise, the Element object has a getAttribute method :

rect.getAttribute("x"); // 100

Classes, IDs and tag names

Classes, IDs and tag names are special properties of the Element objects. It’s extremely common to add or remove classes to elements in visualization: my favorite way to do that is to use the classed method in d3js.

d3.select("rect").classed("myRect", 1)

In vanilla javascript, you have the concept of classList.

document.querySelector("rect").classList; // ["myRect"]

ClassList has a number of cool methods. contains checks if this Element is of a certain class, add adds a class, remove removes a class, and toggles, well, toggles a class.

document.querySelector("rect").classList.contains(["myRect"]); // true
document.querySelector("rect").classList.remove("myRect");
document.querySelector("rect").classList.add("myRect");
document.querySelector("rect").classList.toggle("myRect");

How about IDs ? with d3js, you’d have to treat them as any other property (rect.attr(“id”)). In vanilla javascript, however, you can access it directly via the id property of Element. You can also do that with the name property.
Finally, you can use the tagName to get the type of element you are looking at (though you cannot change it – you can try, it just won’t do anything).

document.querySelector("rect").id = "myRect"; // true
document.querySelector("rect").name; // undefined;
document.querySelector("rect").tagName; // "rect"
document.querySelector("rect").tagName = "circle";
document.querySelector("rect").tagName; // "rect"

Text

Text is a pretty useful aspect of visualization! it is different from attributes or styles, which are set in the opening tag of an element. The text or content is what is happening in between the opening and closing tags of that element. This is why, in d3js, text isn’t set using attr or style, but either by the html method for HTML elements like DIVs or Ps, or by the text method for SVG elements like <text> and <tspan>.

Those have equivalent in the DOM + javascript world.

HTMLelements have the .innerHTML and outerHTML properties. The difference between the two is that outerHTML includes the opening and closing tags. innerHTML and outerHTML both return HTML, complete with tags and syntax.

SVG elements, however, don’t have access to this property, so they have to rely on the Node property textContent. HTML elements also have access to it, by the way. textContent returns just the plain text content of what’s in the element. All three properties can be used to either get or set text.

Style

In d3js, setting styles to elements is very similar to setting attributes, only we use the .style method instead of the .attr one. It’s so much similar that it’s a rather common mistake to pass as attribute what should be a style and vice-versa! Like with attributes, it is possible to pass an object with keys and values to set several style properties at once.

d3.selectAll("rect").style("fill", "red");
d3.selectAll("rect").style({stroke: "#222", opacity: .5});

In the world of DOM and vanilla javascript, style is a property of the HTMLElement / SVGElement objects. You can set style properties one at a time:

rect = document.querySelector("rect");
rect.style.fill = "red";
rect.style.stroke = "#222";
rect.style.opacity = .5;

Technically, .style returns a CSSStyleDeclaration object. This object maintains a “live” link to what it describes. So:

myStyle = rect.style;
rect.style.fill = "yellow";
myStyle.fill; // "yellow"

Finally, the window object has a getComputedStyle method that can get the computed styles of an element, ie how the element is actually going to get drawn. By contrast, the style property and the d3js style method only affect the inline styles of an element and are “blind” to styles of its parents.

myStyle = window.getComputedStyle(rect, null);
myStyle.fill; // "yellow"

Adding and removing events

In d3js, we have the very practical method “on” which let users interact with elements and can trigger behavior, such as transformations, filtering, or, really, any arbitrary function. This is where creating visualizations with SVG really shines because any minute interaction with any part of a scene can be elegantly intercepted and dealt with. Since in d3js, elements can be tied with data, the “on” methods takes that into account and passes the data element to the listener function. One of my favorite tricks when I’m developing with d3js and SVG is to add somewhere towards the end the line:

d3.selectAll("*").on("click", function(d) {console.log(d);})

Which, as you may have guessed, displays the data item tied to any SVG element the user could click on.

In the world of the DOM, the object to which events methods are attached in the EventTarget. Every Element is also an EventTarget (and EventTarget could be other things that handle events too, like xhr requests).

To add an event listener to an element, use the addEventListener method like so.

document
  .querySelector("rect")
  .addEventListener("click", function() {
     console.log("you clicked the rectangle!"
   }, false);

The first parameter is the type of event to listen to (just as in “on”), the second is the listener function proper. The third one, “use capture”, a Boolean, is optional. If set to true, it stops the event from propagating up and being intercepted by event listeners of the parents of this element.

There is also a “removeEventListener” method that does the opposite, and needs the same elements: in other words, yes, you need to pass the same listener function to be able to stop listening to the element. There is no native way to remove all event listeners from an element, although there are workarounds.

Creating and removing elements

Selecting and modifying elements is great, but if you are creating a visualization, chances are that you want to create elements from scratch.

Let’s first talk about how this is done in the DOM/javascript, then we’ll better understand the data joins and d3 angle.

Node objects can exist outside of the hierarchy of the DOM. Actually, they must first be created, then be assigned to a place in the DOM.

Until a Node object is positioned in the DOM, it is not visible. However, it can receive attributes, styles, etc. Likewise, a Node object can be taken from the DOM, and still manipulated.

To create an HTML element, we can use the document.createElement() method:

var myDiv = document.createElement("div");

However, that won’t work for SVG elements – remember in an earlier example, we used the createElementNS method. This is because SVG elements have to be created in the SVG namespace. d3js old-timers may remember that in the first versions, we had to deal with namespaces when creating elements in d3js as well, but now this all happens under the hood.

Anyway, in vanilla javascript, this is  how it’s done:

var svgns = "http://www.w3.org/2000/svg";
var myRect = document.createElementNS(svgns, "rect");

Warning, because document.createElement(“rect”) will not produce anything useful as of this writing.

Once the new Node objects are created, in order to be visible, they should be present in the DOM. Because the DOM is a tree, this means that they have to have a parent.

svg.appendChild(myRect);

Likewise, to remove a Node from the DOM means to sever that relationship with its parent, which is done through the removeChild method:

svg.removeChild(myRect);

Again, even after a Node has been removed, it can still be manipulated, and possibly re inserted at a later time.

Nodes don’t remove themselves, but you can write:

myRect.parentNode.removeChild(myRect);

In contrast, here is how things are done in d3js.

The append method will add one element to a parent.

d3.select("svg").append("rect");

The remove method will remove one entire selection object from the DOM.

d3.select("svg").selectAll("rect").remove(); // removes all rect elements which are children of the SVG element

But the most intriguing and the most characteristic way to create new elements in d3js is to use a data join.

d3.select("svg")
  .selectAll("rect")
  .data(d3.range(5))
  .enter()
  .append("rect");

The above snippet of code counts all the rect children of the svg element, and, if there are fewer than 5 – the number of items in d3.range(5), which is the [0,1,2,3,4] array – creates as many as needed to get to 5, and binds values to those elements – the contents of d3.range(5) in order. If there are already 5 rect elements, no new elements will be created, but the data assignment to the existing elements will still occur.

Data joins, or the lack thereof

The select / selectAll / data / enter / append sequence can sound exotic to people who learn d3js, but to its practitioners, it is its angular stone. Not only is it a quick way to create many elements (which, in vanilla javascript, takes at least 2 steps. Creating them, and assigning them to the right parent), but it also associates them with a data element. That data element can then be accessed each time the element is being manipulated, notably when setting attributes or styles and handling events.

For instance,

d3.selectAll("rect")
  .attr("x", function(d) {return 20 * d;});

the above code utilizes the fact that each of the rectangle have a different number associated with them to dynamically set an attribute, here position rectangles horizontally.

d3.selectAll("rect")
  .on("click", function(d) {console.log(d);})

A trick I had mentioned above, but which illustrates this point: here by clicking on each rectangle, we use the data join to show the associated data element.

Having data readily available when manipulating elements in d3js is extremely convenient. After all, data visualization is but the encoding of data through visual attributes. How to perform this operation without the comfort of data joins?

Simply by going back to the dataset itself.

Consider this:

var data = [];
var i;
for (i = 0; i < 100; i++) {
  data.push({x: Math.random() * 300, y: Math.random() * 300}); // random data points
}

// d3 way
var d3svg = d3.select("body").append("svg");
d3svg.selectAll("circle").data(data).enter().append("circle")
  .attr({cx: function(d) {return d.x;}, cy: function(d) {return d.y}, r: 2})
  .style({fill: "#222", opacity: .5});

// vanilla js way
var svgns = "http://www.w3.org/2000/svg";
var svg = document.createElementNS(svgns, "svg");
document.querySelector("body").appendChild(svg);
for (i = 0; i < 100; i++) {
  var myCircle = document.createElementNS(svgns, "circle");
  myCircle.setAttribute("cx", data[i].x);
  myCircle.setAttribute("cy", data[i].y);
  myCircle.setAttribute("r", 2);
  myCircle.style.fill = "#222";
  myCircle.style.opacity = .5;
  svg.appendChild(myCircle);
}

See the Pen eNzaYg by Jerome Cukier (@jckr) on CodePen.

Both codes are equivalent. Vanilla JS is also marginally faster, but d3 code is much more compact. In d3js, the process from dataset to visual is:

  • Joining dataset to container,
  • Creating as may children to container as needed, [repeat operation for as many levels of hierarchy as needed],
  • Use d3 selection objects to update the attributes and styles of underlying Node objects from the data items which have been joined to them.

    In contrast, in vanilla Javascript, the process is:

  • Loop over the dataset,
  • create, position and style elements as they are read from the dataset.

For visuals with a hierarchy of elements, the dataset may also have a hierarchy and could be nested. In this case, there may be several nested loops. While the d3js code is much more compact, the vanilla approach is actually more simple conceptually. Interestingly, this is the same logic that is at play when creating visualization with Canvas or with frameworks like React.js. To simply loop over an existing, invariant dataset enables you to implement a stateless design and take advantage of immutability. You don’t have to worry about things such as what happens if your dataset changes or the status that your nodes are in before creating or updating them. By contrast most operations in d3js assume that you are constantly updating a scene on which you are keeping tabs. In order to create elements, you would first need to me mindful on existing elements, what data is currently associated with them, etc. So while the d3js approach is much more convenient and puts the data that you need at your fingertips, the vanilla JS approach is not without merits.

Loading files

The first word in data visualization is data, and data comes in files, or database queries. If you’re plotting anything with more than a few datapoints, chances are you are not storing them as a local variable in your javascript. d3js has a number of nifty functions for that purpose, such as d3.csv or d3.json, which allow to load the files asynchronously. The trick in working with files is that it can take some time, so some operations can take place while we wait for the files to load, but some others really have to wait for the event that the file is loaded to start. I personally almost always use queue.js, also from Mike Bostock, as I typically have to load data from several files and a pure d3 approach would require nesting all those asynchronous file functions. But, for loading a simple csv file, d3js has a really simple syntax:

d3.csv("myfile.csv", function(error, csv) {
  // voila, the contents of the file is now store in the csv variable as an array
})

For reference, using queue js, this would look like

queue()
 .defer(d3.csv, "myFirstFile.csv")
 .defer(d3.csv, "mySecondFile.csv")
 .await(ready);

function ready(error, first, second) {
  // the contents of myFirstFile is stored as an array in the variable "first",
  // and the contents of mySecondFile are in the variable "second".
}

The way to do the equivalent in vanilla Javascript is to use XMLHttpRequest.

function readFile() {
  var fileLines = this.responseText.split("\n");
  var fields = fileLines[0].split(",");
  var data = fileLines.slice(1).map(function(d) {
    var item = {};
    d.split(",").forEach(function(v, i) {item[fields[i]] = v;})
    return item;
  })

  var request = new XMLHttpRequest();
  request.onload = readFile;
  request.open("get", "myFile.csv", true);
  request.send();

The syntax of loading the file isn’t that cumbersome, and there are tons of nice things that can be done through XMLHttpRequest(), but let’s admit that d3js/queue.js functions make it much more comfortable to work with csv files.

Animations

d3js transitions is one of my favorite part of the library. I understand it’s also one the things which couldn’t be done well in protovis and which caused that framework to break. It feels so natural: you define what you want to animate, all that needs to change, the time frame and the easing functions, and you’re good to go (see my previous post on animations and transitions). In native javascript, while you can have deep control of animations, it’s also, unsurprisingly, much more cumbersome. However, CSS3 provides an animation interface which is comparable in flexibility, expressiveness and ease of use to what d3js does. First let’s get a high-level view of how to do this entirely within JS. Then let’s get a sense of what CSS can do.

requestAnimationFrame and animation in JavaScript

JavaScript has timer functions, window.setTimeout and window.setTimeinterval, which let you run some code after a certain delay or every so often, respectively. But this isn’t great for animation. Your computer draws to screen a fixed number of times per second. So if you try to redraw the same element several times before in between those times, it’s a waste of resources! What requestAnimationFrame does is tell your system to wait for the next occasion to draw to execute a given function. Here’s how it will look in general.

function animate(duration) {
  var start = Date.now();
  var id = requestAnimationFrame(tick);
  function tick() {
    var time = Date.now();
    if (time - start < duration) {
       id = requestAnimationFrame(tick);
       draw(time - start / duration);
    } else {
      cancelAnimationFrame(id);
    }
  }
  function draw(frame) {
    // do your thing, update attributes, etc.
  }
}


See the Pen PqzgLV by Jerome Cukier (@jckr) on CodePen.

OK so in the part I commented out, you will do the drawing proper. Are you out of the woods yet? well, one great thing about d3js transitions is that they use easing functions, which transform a value between 0 and 1 into another value between 0 and 1 so that the speed of the animation isn’t necessarily uniform. In my example, you have (time – start) / duration represents the proportion of animation time that has already elapsed, so that proportion can be further transformed.

So yay we can do everything in plain javascript, but that’s a lot of things to rewrite from scratch.

CSS3, animations and transitions

(This is not intended to be an exhaustive description of animations and transitions, a subject on which whole books have been written. Just to give those who are not familiar with it a small taste).

In CSS3, anything you can do with CSS, you can time and animate. But there are some caveats.

There are two similar concepts to handle appearance change in CSS: animations and transitions. What is the difference?

  • with animations, you describe a @keyframes rule, which is a sequence of states that happen at different points in time in your transition. In each of these events, any style property can be changed. The animation will transform smoothly your elements to go from one state to the next.
  • in transitions, you specify how changes to certain properties will be timed. For instance, you can say that whenever opacity changes, that change will be staged over a 1s period, as opposed to happen immediately.

Both approaches have their uses. CSS3 animations are great to create complex sequences. In d3js, that requires to “chain transitions”, which is the more complex aspect of managing them. By contrast, going from one segment of the animation to another is fairly easy to handle in CSS3. Animations, though, require the @keyframes rule to be specified ahead of time in a CSS declaration file. And yes, that can be done programmatically, but it’s cumbersome and not the intent. The point is: animations work better for complex, pre-designed sequence of events.

Transitions, in contrast, can be set as inline styles, and work fine when one style property is changed dynamically, a scenario which is more likely to happen in interactive visualizations.

Here’s how they work. Let’s start with animations.

See the Pen vOKKYN by Jerome Cukier (@jckr) on CodePen.

Note: as of this writing, animation-related CSS properties have to be vendor prefixed, i.e. you have to repeat writing these rules for the different browsers. Here’s a transition in action.

See the Pen xGOqOR by Jerome Cukier (@jckr) on CodePen.

For transition, you specify one style property to “listen” to, and say how changes to that property will be timed, using the transition: name of property + settings. (in the above example: transition: transform ease 2s means that whenever the “transform” style of that element changes, this will happen over a 2s period with an easing function). 

One big caveat for both CSS animations and transitions is that they are limited to style properties. In HTML elements this is fine because everything that is related to their appearance is effectively handled by style: position, size, colors, etc. For SVG, however, color or opacity are styles, like in HTML, but positions, sizes and shapes are attributes, and can’t be directly controlled by CSS. There is a workaround for positions and sizes, which is to use the transform style property.

But wait: isn’t transform an SVG attribute as well? that’s right. And that’s where it can get really confusing. Many SVG elements are positioned through x and y properties (attributes). They can also have a transform property which is additive to that. For instance, if I have a <rect> which has an x property of 100 and a transform set at “translate(100)”, it will be positioned 200px right of its point of origin. But on top of that, SVG elements can have a transform style which affects pretty much the same things (position, scales, rotation…) but which has a slightly different syntax (“translate(100)”, for instance, wouldn’t work, you’d have to write “translateX(100px)”). What’s more, the transform set in the style doesn’t add to the one set in the properties, but it overrides it. If we add a “transform: translateX(50px)” to our <rect>, it will be positioned at 150px, not 200px or 250px. Another potential headache is that some SVG elements cannot support transform styles.
While any of these properties can be accessed programmatically, managing their potential conflicts and overlaps can be difficult. In the transition example above, I have used the transform/translateX syntax.

That said, a lot of awesome stuff can be done in CSS only. For scripted animations, the animation in pure CSS is definitely more powerful and flexible than the d3js equivalent, however, when dealing with dynamically changing data, while you can definitely handle most things through CSS transitions, you’ll appreciate the comfort of d3js style transitions.

See the Pen GJqrLO by Jerome Cukier (@jckr) on CodePen.

Now a common transformation handled by d3js transitions is to transform the shape of path shapes. This is impossible through CSS animations/transitions, because the shape of the path – the “d” – is definitely not a style property. And sure, we can use a purely programmatic approach with requestAnimationFrame but is there a more high level way?
It turns out there actually is – the animation element of SVG, or SMIL. Through SMIL, everything SVG can be animated with an interface, this includes moving an object along a path, which I wouldn’t know how to do on top of my head in d3js. Here is an extensive explanation of how this works and what can be done.

Data processing, scales, maps and layouts

For the end of the article let’s talk about all of which could technically be done without d3js, but in a much, much less convenient way. Therefore, I won’t be discussing alternatives with vanilla Javascript, which would be very work intensive and not necessarily inventive.

Array functions and data processing

d3js comes with a number of array functions. Some are here for convenience, such as d3.min or d3.max which can easily be replaced by using the native reduce method of arrays. When comparing only two variables, d3.max([a, b]) is not much more convenient than Math.max(a,b) or a > b ? a : b.

Likewise, d3js has many statistical functions, which saves you the trouble to implement them yourself if you need them, such as d3.quantile. There are other libraries who do that, but they’re here and it’s really not useful to recode that from scratch.

d3js comes with shims for maps and sets, which will be supported by ES6. By now, there are transpilers which can let you use ES6 data structures. But it’s nice to have them.

In my experience, d3js most useful tool in terms of data processing is the d3.nest function, which can transform an array of objects into a nested object. (I wrote this article about them).  Underscore has something similar. While you can definitely getting a dataset of any shape and size by parsing an array and performing any grouping or operations manually, this is not only very tedious but also extremely error prone.

Scales

Scales are one superb feature of d3js. They are simple to understand, yet very versatile and convenient. Oftentimes, d3 scales, especially the linear ones, are a replacement for linear algebra.

d3.scale.linear().range([100, 500]).domain([0, 24])(14);
((14 - 0) / (24 - 0)) * (500 - 100) + 100; // those two are equivalent (333.33...)

but changing the domain or the range of a scale is much safer using the scale than adhoc formulas. Add to this scale goodness such as the ticks() method or nice() to round the domain, and you get something really powerful.

So, of course it is possible (and straightforward, even) to replace the scales but that would be missing out one of the best features of d3js.

Maps

d3js comes with a full arsenal of functions and methods to handle geographic projections, ie: the transformation of longitude/latitude coordinates into x,y positions on screen. Those come in two main groups, projections proper that turn an array of two values (longitude, latitude) into an array of two values (x, y). There are also paths functions that are used to trace polygons, such as countries, from specially formatted geographic files (geoJSON, topoJSON).

The mercator projection may be straightforward to implement, But others are much less so. The degree of comfort that d3js provides when visualizing geographical data is really impressive.

Layouts

d3js layouts, that is special visual arrangements of data, were in my opinion one of the key drivers of protovis (where they originated) then d3js adoption. Through layouts, it became simple to create, with a few line of codes, complex constructions like treemaps or force-directed networks. Some layouts, like the pie chart or the dendogram, are here for convenience and could be emulated. Others, and most of all the force layout, are remarkably implemented, efficient and versatile. While they are called different names in d3js, geometry functions such as voronoi tessellation or convex hulls are similar functionally and there is little incentive in reproducing what they do in plain javascript.

Should I stop using d3?

d3js is definitely the most advanced javascript visualization library. The point of this article is not to get you to stop using it, but rather, to have a critical thinking in your code. Even with the best hammer, not everything is a nail.

To parse the DOM, manipulate classes and listen to events, you probably don’t need a library. The context of your code may make it more convenient to use d3 or jQuery or something else, but it’s useful to consider alternatives.
The concept of the data join unlocks a lot of possibilities in d3js. A good understanding of data join would lead you to implement your visualization much faster, using more concise code and replicable logic. It also makes trouble shooting easier. Data joins are especially useful if you have a dataset which is structured like your visualization should be, or if you plan to have interaction with your visualization that requires quick access with the underlying data. However, data joins are not necessary in d3js, or in visualization in general. In many cases, it’s actually perfectly sensible to parse a dataset and create a visual representation in one fell swoop, without attaching the data to its representation or overly worrying about updating.

Assuming you have d3js loaded, nothing prevents you from creating elements using d3js append methods instead of vanilla javascript. Or to listen to events using addEventListener rather than with d3js on method. It’s totally ok to mix and match.

Like data joins, transitions are a very powerful component of d3js, and, once you’re comfortable with them, they are very expressive. There are other animation frameworks available though, which can be better adapted to the task at hand.
Scale, maps, layouts and geometries are extremely helpful features however and I can think of no good reason to reimplement them.

Credit where it’s due

To write this I drew inspiration from many articles and I will try to list them all here.
The spark that led me to write was Lea Verou’s article jQuery considered harmful, as well as articles she cites (you might not need jQuery, you don’t need jQuery, Do you really need jQuery?, 10 tips for writing JavaScript without jQuery).

Most of the information I used especially in the beginning of the article comes more or less directly from MDN documentation, and direct experimentation. For CSS and animation, I found the articles of Chris Coyier (such as this one or this one) and Sara Soueidan (here) on CSS Tricks to be extremely helpful. Those are definitely among the first resources to check out to go deeper on the subject. Sara was also the inspiration behind my previous post, so thanks to her again!

Finally, I’ve read Replacing jQuery with d3 with great interest (like Fast interactive prototyping with d3js and sketch about a year ago). It may seem that what I write goes in the opposite direction, but we’re really talking about the same thing -that there are many ways to power front ends and that it’s important to maintain awareness of alternative methods.