In protovis, scales were super-useful in just about everything. That much hasn’t changed in d3, even though d3.scale is a bit different from pv.Scale. (do note that d3.scale is in lowercase for starters).
Scales: the main idea
Simply put: scales transform a number in a certain interval (called the domain) into a number in another interval (called the range).
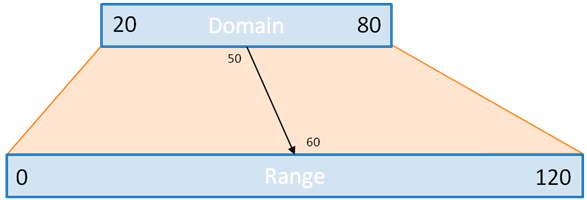
For instance, let’s suppose you know your data is always over 20 and always below 80. You would like to plot it, say, in a bar chart, which can be only 120 pixels tall.
You could, obviously, do the math:
.attr("height", function(d) {return (d-20)*2;})
But what if you suddenly have more or less space? or your data changes? you’d have to go back to the entrails of your code and make the change. This is very error prone. So instead, you can use a scale:
var y=d3.scale.linear().domain(20,80).range(0,120);
...
.attr("height", y)
this is much simpler, elegant, and easy to maintain. Oh, and the latter notation is equivalent to
.attr("height", function(d) {return y(d);})
… only more legible and shorter.
And, there are tons of possibility with scales.
Fun with scales
In d3, quantitative scales can be of several types:
- linear scales (including quantize and quantile scales,
- logarithmic scales,
- power scales (including square root scales)
While they behave differently, they have a lot in common.
Domain and range
For all scales, with the exception of quantize and quantile scales which are a bit different, domain and range work the same.
First, note that unlike in protovis, domain and range take an array as argument. Compare:
var y=pv.Scale.linear().range(20,60).domain(0,120);
var y=d3.scale.linear().range([20,60]).domain([0,120]);
This is because contrary to protovis, where domain could be a whole dataset, in d3, domain contains the bounds of the interval that is going to be transformed.
Typically, this is two numbers. If this is more, we are talking about a polypoint scale: there are as many segments in the intervals as there are numbers in the domain (minus one). The range must have as many numbers, and so as many segments. When using the scale, if a number is in the n-th segment of the domain, it is transformed into a number in the n-th segment of the range.
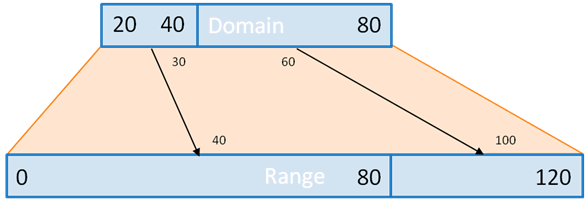
With this example, 30 finds itself in the first segment of the domain. So it’s transformed to a value in the first segment of the range. 60, however, is in the 2nd segment, so it’s transformed into a value in the 2nd segment of the range.
Also, bounds of domain and range need not be numbers, as long as they can be converted to numbers. One useful examples are colors. Color names can be used as range, for instance, to create color ramps:
var ramp=d3.scale.linear().domain([0,100]).range(["red","blue"]);
This will transform any value betwen 0 and 100 into the corresponding color between red and blue.
Clamping
What happends if the scale is asked to process a number outside of the domain? That’s what clamping controls. If it is set, then the bounds of the range are the minimum and maximum value that can be returned by the scale. Else, the same transformation applies to all numbers, whether they fall within the domain or not.
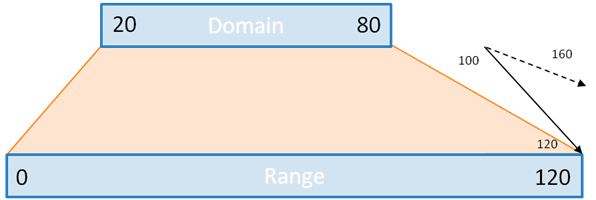
Here, with clamping, the result of the linear transformation is 120, but without it, it’s 160.
var clamp=d3.scale.linear().domain([20,80]).range([0,120]);
clamp(100); // 160
clamp.clamp(true);
clamp(100); // 120
Scales and nice numbers
More often than not, the bounds of the domain and/or those of the ranges will be calculated. So, chances are they won’t be round numbers, or numbers a human would like. Scales, however, come with a bunch of method to address that. d3 keeps in mind that scales are often used to position marks along an axis.
.nice()
When applied to a scale, the nice method expends the domain to “nicer” numbers. You wouldn’t want your axis to start at -2.347 and end at 7.431, right?
So, there.
var data=[-2.347, 4, 5.23,-1.234,6.234,7.431]; // or whatever.
var y=d3.scale.linear().range([0,120]);
y.domain([d3.min(data), d3.max(data)]); // domain takes bounds as arguments, not all numbers
y.domain() // [-2.347, 7.431];
y.nice() // [-3, 8]
.ticks(n)
Given a domain, and a number n (which, contrary to protovis, is mandatory in d3), the ticks method will split your domain in (more or less) n convenient, human-readable values, and return an array of these values. This is especially useful to label axes. Passing these values to the scale allows them to position ticks nicely on an axis.
var y=d3.scale.linear([20,80]).range([0,120]);
...
var ticks=axis.selectAll("line")
  .data(y.ticks(4)) // 20, 40, 60 and 80
  .enter().append("svg:line");
ticks
  .attr("x1",0).attr("x2",5)
  .attr("y1",y).attr("y2",y) // short and simple.
  .attr("stroke","black");
.rangeRound()
If used instead of .range(), this will guarantee that the output of the scales are integers, which is better to position marks on the screen with pixel precision than numbers with decimals.
.invert()
The invert function turns the scale upside down: for one given number in the range, it returns which number of the domain would have been transformed into that number.
For instance:
var y=d3.scale.linear([20,80]).range([0,120]);
y(50); // 60
y.invert(60); // 50
That’s quite useful, for instance, when a user mouses over a chart, and you would like to know to what value the mouse coordinates correspond.
Power scales and log scales
The linearscale is a function of the form y=ax+b which works for both ends of the domain and range. In the example we’ve used most often until now, this function is really f(x): y=2x-40.
Power and logarithm scales work the same, only we are looking for a function of the form y=axk+b, or y=a.log(x)+b.
For the power scales, you can specify an exponent (k) with the .exponent() method. For instance, if we specify an exponent of 2, here is what the scale would look like:
The equation is now f(x): y=x²/50-8. So 20 still becomes 0 and 80 still becomes 120, but other than that the values at the beginning of the domain would be lower than with the linear scale, and those at the end of the scale will be higher.
For convenience, d3 includes a d3.scale.sqrt() (the square root scale) so you never have to type d3.scale.pow.exponent(0.5) in full.
Also note that if you are using a log scale, you cannot have 0 in the domain.
Quantize and quantile
quantize and quantile are specific linear scales.
quantize works with a discrete, rather than continuous, range: in other terms, the output of quantize can only take a certain number of values.
For instance:
var q=d3.scale.quantize().domain([0,10]).range([0,2,8]);
q(0); // 0
q(3); // 0
q(3.33); // 0
q(3.34); // 2
q(5); // 2
q(6.66); // 2
q(6.67); // 8
q(8); // 8
q(1000); // 8
quantile on the other hand matches values in the domain (which, this time, is the full dataset) with their respective quantile. The number of quantiles is specified by the range.
For instance:
var q=d3.scale.quantile().domain([0,1,5,6,2,4,6,2,4,6,7,8]).range([0,100]);
q.quantiles(); // [4.5], only one quantile - the median
q(0); // 0
q(4); // 0
q(4.499); // 0
q(4.5); // 100 - over the median
q(5); // 100
q(10000); // 100
q.range([0,25,50,75,100]);
q.quantiles(); // [2, 4, 5.6, 6];
q(0); // 0
q(2); // 25 - greater than the first quantile limit
q(3); // 25
q(4); // 50
q(6); // 100
q(10000); // 100
Ordinal scales
All the scales we’ve seen so far have been quantitative, but how about ordinal scales?
The big difference is that ordinal scales have a discrete domain, in other words, they turn a limited number of values into something else, without caring for what’s between those values.
Ordinal scales are very useful for positioning marks along an x axis. Let’s suppose you have 10 bars to position for your bar chart, each corresponding to a category, a month or whatever.
For instance:
var x=d3.scale.ordinal()
  .domain(["Sunday","Monday","Tuesday","Wednesday","Thursday","Friday","Saturday"]) // 7 items
  .rangeBands([0,120]);
x("Tuesday"); // 34.285714285714285
There are 3 possibilites for range. Two are similar: the .rangePoints() and .rangeBands() methods, which both work with an array of two numbers – i.e. .rangeBands([0,120]). The last one is to specify all values in the range with .range().
rangePoints() and rangeBands()
With .rangePoints(interval), d3 fits n points within the interval, n being the number of categories in the domain. In that case, the value of the first point is the beginning of the interval, that of the last point is the end of the interval.
With .rangeBands(interval), d3 fit n bands within the interval. Here, the value of the last item in the domain is less than the upper bound of the interval.
Those methods replace the protovis methods .split() and .splitBanded().
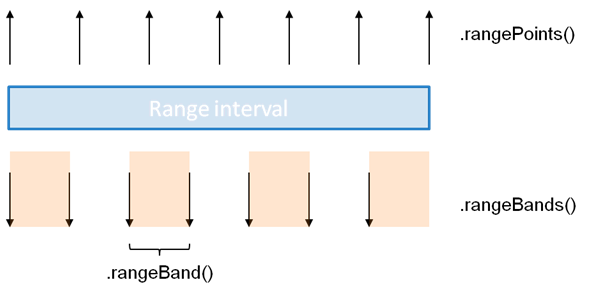
This chart illustrates the difference between using rangeBands and rangePoints.
var x=d3.scale.ordinal()
  .domain(["Sunday","Monday","Tuesday","Wednesday","Thursday","Friday","Saturday"]);
x.rangePoints([0,120]);
x("Saturday"); // 120
x.rangeBands([0,120]);
x("Saturday"); // 102.85714285714286
x("Saturday")+x.rangeBand(); // 120
the range method
Finally, we can also use the .range method with several values.
We can specify the domain, or not. Then, if we use such a scale on a value which is not part of the domain (or if the domain is left empty), this value is added to the domain. If there are n values in the range, and more in the domain, then the n+1th value of the doamin is matched with the 1st value in the range, etc.
var x=d3.scale.ordinal().range(["hello", "world"]);
x.domain(); // [] - empty still.
x(0); // "hello"
x(1); // "world"
x(2); // "hello"
x.domain(); // [0,1,2]
Color palettes
Unlike in protovis, which had them under pv.Colors – i.e. pv.Colors.category10(), in d3, built-in color palettes can be accessed through scales. Well, even in protovis they had been ordinal scales all along, only not called this way.
There are 4 built-in color palette in protovis: d3.scale.category10(), d3.scale.category20(), d3.scale.category20b(), and d3.scale.category20c().
A palette like d3.scale.category10() works exactly like an ordinal scale.
var p=d3.scale.category10();
var r=p.range(); // ["#1f77b4", "#ff7f0e", "#2ca02c", "#d62728", "#9467bd",
                      // "#8c564b", "#e377c2", "#7f7f7f", "#bcbd22", "#17becf"]
var s=d3.scale.ordinal().range(r);
p.domain(); // [] - empty
s.domain(); // [] - empty, see above
p(0); // "#1f77b4"
p(1); // "#ff7f0e"
p(2); // "#2ca02c"
p.domain(); // [0,1,2];
s(0); // "#1f77b4"
s(1); // "#ff7f0e"
s(2); // "#2ca02c"
s.domain(); // [0,1,2];
It’s noteworthy that in d3, color palette return strings, not pv.Color objects like in protovis.
Also:
d3.scale.category10(1); // this doesn't work
d3.scale.category10()(1); // this is the way.
Colors
Compared to protovis, d3.color is simpler. The main reason is that protovis handled color and transparency together with the pv.Color object, whereas in SVG, those two are distinct attributes: you handle the background color of a filled object with fill, its transparency with opacity, the color of the outline with stroke and the transparency of that color with stroke-opacity.
d3 has two color objects: d3_Rgb and d3_Hsl, which describe colors in the two of the most popular color spaces: red/green/blue, and hue/saturation/light.
With d3.color, you can make operations on such objects, like converting colors between various formats, or make colors lighter or darker.
d3.rgb(color), and d3.hsl(color) create such objects.
In this context, color can be (straight from the manual):
- rgb decimal – “rgb(255,255,255)”
- hsl decimal – “hsl(120,50%,20%)”
- rgb hexadecimal – “#ffeeaa”
- rgb shorthand hexadecimal – “#fea”
- named – “red”, “white”, “blue”
Once you have that object, you can make it brighter or darker with the appropriate method.
You can use .toString() to get it back in rgb hexadecimal format (or hsl decimal), and .rgb() or .hsl() to convert it to the object in the other color space.
var c=d3.rgb("violet") // d3_Rgb object
c.toString(); // "#ee82ee"
c.darker().toString(); // "#a65ba6"
c.darker(2).toString(); // "#743f74" - even darker
c.brighter().toString();// "ffb9ff"
c.brighter(0.1).toString(); // "#f686f6" - only slightly brighter
c.hsl(); // d3_Hsl object
c.hsl().toString() // "hsl(300, 76, 72)"
Very Nice article. Thanks
That’s a very useful addition to the API docs. Thanks a lot!
it’s possible to change the interpolator used for scales by just any function.
the interpolator is the function that does the actual conversion.
this is the equivalent to a linear interpolator –
.interpolate(function(a,b) {return function(t) {return a+t*(b-a);};})
where a and b are minimum and maximum of the range, and t is the number to be converted, normalized to [0,1].
(actually, the default interpolator is more powerful, because it can also work with more than just numbers, but that’s the idea).
so, this can work with just any function that can turn an interval and a number into another value.
Any ideas on how one would make a log based 2 scale in d3? In fact any tips on making axes without a scale if in fact it’s not possible to do log based 2 would be really helpful!
Thanks,
Shimona
Probably one of the best posts on d3, and certainly better than 90% of the blog posts on the internet. Thank you so much, especially for the diagrams (a picture’s worth more than 1,000 words of API documentation).
Jerome, what you’ve created here is the one of the best articles on d3 i’ve met so far.
Thank you for sharing this to the world!
Finally – ordinal scales explained.
Thank you Jerome
Minor edit on ordinal scales section:
remove semicolon appearing between end of .domain and beginning of .range.
var x=d3.scale.ordinal()
.domain([“Sunday”,”Monday”,”Tuesday”,”Wednesday”,”Thursday”,”Friday”,”Saturday”]) // 7 items
.rangeBands([0,120]);
thanks for your vigilance! corrected 🙂
Thank you for all the work on these d3 blog posts!
Wow! After reading a few d3 articles and the d3 api docs and not quite understanding domain and scales, this succinct article made it click.
Thank you so much!
Great article. Very well explained
It’s almost 2015, and your article is still very useful. Thanks !
Never one to miss a parade: I too found this article very helpful; certainly in my top 5 of most useful d3 posts.
Indeed this is very helpful and a strong add-on to the official documentation. Thank you!