Beyond rendering

This is the 5th post in my Visualization with React series. Previous post: React components

The lifecycle functions

I’m not going to go into great details on this, but a talk on React without mentioning the lifecycle functions would not be complete.
React components come with several functions which are fired when certain events occur, such as when the component is first created (‘mounts’), when it’s updated or when it’s removed (‘unmounts’).
Pure functional components, which we’ve been mostly using, don’t have lifecycle functions.
But components with a state can have them.

Some examples of usage of those lifecycle functions include:

  • Before the component is rendered, you can load data. that’s a job for ‘componentWillMount’.
  • After a component is rendered, you can animate it, or add an event listener. Use ‘componentDidMount’.
  • Prevent a component from rendering under certain circumstances, even if it receives new properties or its state changes. Use ‘shouldComponentUpdate’.
  • After a component receives new props or new state, you can trigger another function before the component updates (‘componentWillUpdate’) or right after (‘componentDidUpdate’).
  • When a component is going to be removed, you can do some cleanups, like deleting event listeners. Use ‘componentWillUnmount’.

Oftentimes, you can simply get by by using the default behavior of React components, which re-render only when they receive different properties or when their state changes. But it can be really convenient to have that extra degree of control.

Here is an example of using these lifecycle functions in context.

See the Pen lifecycle functions example by Jerome Cukier (@jckr) on CodePen.

What is going on there?
We’re adapting our earlier scatterplot example, only this time, we are not using pure functional components (which don’t have those lifecycle functions), but creating classes.
We’re going to have three classes: Chart, at the highest level; Scatterplot, a child of Chart; and Points.
Chart passes data to Scatterplot. What it passes depends on whether the button is clicked. That button changes the state of Chart (which causes a rerendering of the Scatterplot and the Point elements).
Chart also has a private variable that holds a message we can display on top. We can still use callback functions to change this variable, just like we change the state, but the difference between changing the state and changing a private variable is that changing a private variable doesn’t cause the children to re-render.
When we first create the scatterplot element, the componentDidMount function is called, and the message is changed to reflect that.
Then, each time we click the button, a different data property is passed to the Scatterplot element. Also, the componentDidUpdate method is triggered, which changes the message.
(changing the state of the parent from a componentDidUpdate method can cause an endless re-rendering loop, this is why I used private variables instead of the state, and there are ways to address this but for the sake of brevity this is the easiest way to deal with that problem).
Now, when a full dataset is passed to the Scatterplot element, many Point elements will be created. I’ve also added a lifecycle method to these Points: when they are first created, they receive a small animation. To that end, I have also used the componentDidMount method, but this time at the Point level.
Exit animations are also possible, but – full disclosure – they are less easy to implement in React than entry animations, or than in D3. So again in the interest of concision I’ll skip these for now.

React and D3

We just saw that with React, we can create a DOM element, then immediately after, call a function to do whatever we want, such as manipulating that element. That function would have access to all the properties and state of that React element.
So what prevents us from combining React and D3? Nothing!
We can create components that are, essentially, an SVG element, then use componentDidMount to perform D3 magic on that element.
Here’s an example:

See the Pen mixing react and d3 by Jerome Cukier (@jckr) on CodePen.

In that example, I have used a bona fide bl.ocks (https://bl.ocks.org/mbostock/7881887) and wrapped it inside a React component. So I can create one, or in the case of that example, several such elements by just passing properties. Those components can perfectly function as black boxes: we give them properties, they give us visualizations that correspond to these parameters. And it doesn’t have to be D3 – once a React element has been created, we can use componentDidMount to do all kinds of operations on it.

In the last 2 articles I will present actual data visualization web apps made with React.
In the next post, we’ll see how to set up a simple web app and we’ll create our first example app.


Coding with React

This article is part of my series Visualization with React. Previous article: An ES6 primer

Setting things up in Codepen

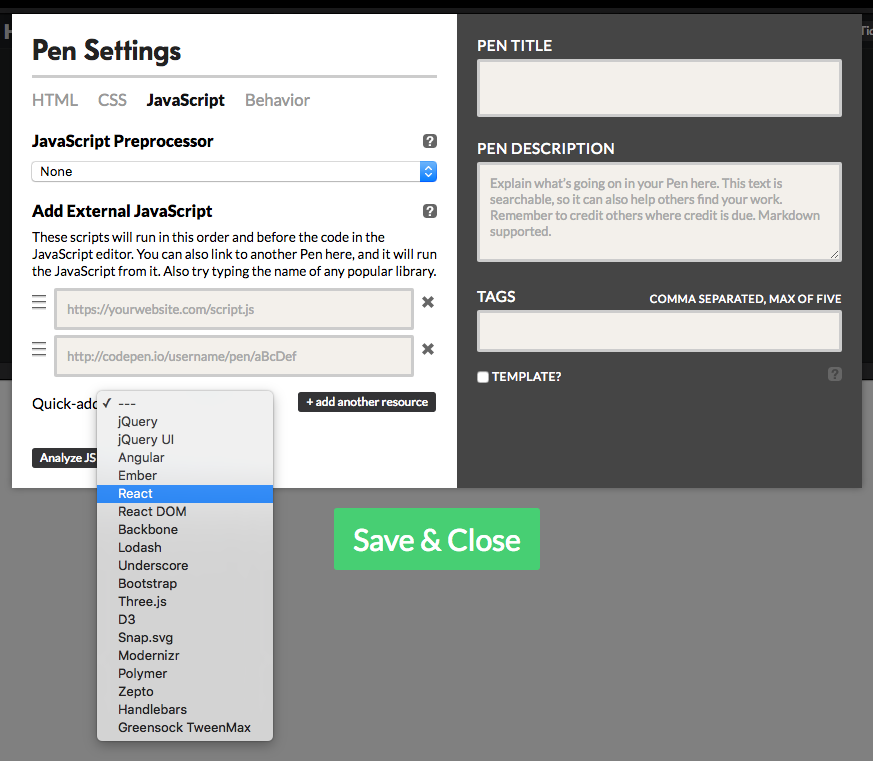
In the last two articles of the series, I’ll cover how to get a real React coding environment going, but to start dabbling, playgrounds like jsFiddle or codepen are great. I’m partial to codepen. When you create a new pen, you still have a couple of options to set up before you can start creating React code:

In the Settings / Javascript / quick-add section (the drop-down at the bottom left) please choose React, then React DOM.

All of the code examples of articles 1, 3, 4, and 5 can be found in this codepen collection.

Creating elements

See the Pen React simple scatterplot by Jerome Cukier (@jckr) on CodePen.

In this first React example, we’re going to create a couple of very simple elements and render them. Let’s start by the end: ReactDOM.render(myDiv, document.querySelector('#root')); We use ReactDOM.render to, well, render something we have created (myDiv) somewhere in our document (on top of what corresponds to the ‘#root’ selection. We conveniently have a div with the id “root” in the HTML part of the pen). That’s it! we’ve output something using React. While the syntax can appear a bit daunting, it really does one simple thing: take what you’ve made and put it where it should be. But what’s that myDiv? To find out, let’s look at the first 2 lines of our code. const mySpan = React.createElement('span', {style: {fontFamily: 'sans-serif'}}, 'hello React world'); const myDiv = React.createElement('div', {className: 'my-div'}, mySpan); Oh, so before there was a myDiv, there was a mySpan. MySpan is a React element, the building brick of the React eco system. To create it, we use React.createElement which is the workhorse of React. React.createElement takes three arguments: the type of React element we are creating, its properties, and its content. The type of element can be any HTML or SVG element, and we’ll see later that we can also make our own. The second argument is the properties. It’s an object. In the d3 world, the properties could be what goes in the attr method. So when you create an SVG element like a rect, its properties could include things like x, y, width and height. In d3, style is treated slightly differently. This is also the case in React. When using React.createElement with an HTML or SVG element, that could be styled using CSS, you can use a style property to pass a style object. That style object contains all CSS properties you want to apply to the object, but instead of hyphenating them, they are written in camel case (so font-family, for instance, becomes fontFamily). The third argument is content: it can either be a string, a single React element, or an array of React elements. In the first line (mySpan) we’ve used a string. So, this first line created a React element which is a span, which contains “hello React world”, and which has a simple style applied to it. In the second line, we create a second React element. Again, React.createElement takes three arguments: type of element (now it’s an HTML div), properties and content. Instead of providing a string, we can pass another React element, such as mySpan that we created above. And that’s it! we’ve rendered something using react.

Creating elements from data

In the example above, we’ve used React.createElement with two kind of content: a string and another React element. But I mentioned that there was a third possibility: an array of React elements. If you’re familiar with d3, you might think: in d3, I could do that from an array of data. The idea in React is pretty similar, only, instead of using select / selectAll / data / enter / append, we can just create our array.

See the Pen React simple scatterplot by Jerome Cukier (@jckr) on CodePen.

One simple way to do that is to use map: myArray.map(d => React.createElement(...)). This is exactly what we are doing in the snippet of code above. This uses the birthdeathrates dataset, one of the example files provided with R (number of births and deaths per thousand people per year in various countries.) The interestingness happens here:

birthdeathrates.map(
  (d, i) => React.createElement('div', {
    'key': i,
    'style': {
       background: '#222',
       borderRadius: 5,
       height: 10,
       left: 5 * d.birth,
       top: 300 - 5 * d.death,
       position: 'absolute',
       width: 10,
       opacity: .2}
  })
)

In the properties that I pass, some depend on the underlying data. This is a mapping so it’s going to return something for each item of the array. Each item of the array is represented by d, and has the birth, death and country properties. In left and top, we use a calculation based on these properties. And for each item, we get a React element created with these calculations. This isn’t unlike what we’d had in d3 if we had written:

 ...
 .selectAll('div')
 .data(birthdeathrates)
 .enter()
 .append('div')
 .style({ ..., left: d => 5 * d.birth, top: d => 300 - 5 * d.death, ...})

Take note of the key property in the react code. This is necessary when you create many elements using map (well not really necessary but strongly recommended, you’d get a warning if you don’t use it). This is used so that if for some reason your parent element has to re-render, each child element will only be re-rendered if needed. If you’ve followed this far, you are now capable of doing things in React the critical part of what you were doing with d3: creating elements out of data. You might wonder: but does it work for svg? yes, and the logic is exactly the same:

See the Pen React simple scatterplot by Jerome Cukier (@jckr) on CodePen.

Introducing JSX

See the Pen React simple scatterplot JSX by Jerome Cukier (@jckr) on CodePen.

At this point you might think: all of this is great, but typing React.createElement all the time is kind of cumbersome. Many people do too, and there are a number of ways to not do that. The most popular, and the one in use at Facebook, is JSX. I personally use r-dom most of the time, but since JSX is definitely the most common way to write React, now that you have a feel for what React.createElement does, it’s not unreasonable to continue with JSX.

The main idea of JSX is that you’ll write tags in your javascript. Instead of writing:

React.createElement('type', {property1: value1, property2: value2, ...}, content)

you would write:

<type property1={value1} property2={value2} ...>
content
</type>

So in our previous example, we create an SVG element that has a width and a height property.
We’d write:

const svg = <svg height={300} width={300}>
//... content ...
</svg>

Inside the opening tag, we list all the properties and we give them a value. This isn’t unlike what you’d see when you watch the source of an HTML file.
The value of the properties go inside curly braces, unless they are a string. For length-type values (ie height, width, top, left, font-size…) if a number is provided, it’s assumed it’s in px.
If the element we create has other elements inside of it, there has to be an opening and a closing tag (ie <element> and </element>). But if there isn’t, there can be a single tag (ie <element />)
Inside our svg, we have a bunch of circle elements. They are of the form:

<circle 
  cx={5 * d.birth}
  cy={300 - 5 * d.death}
  key={i}
  r={5}
  style={{
    fill: '#222',
    opacity: .2
  }}
/>

inside our curly braces, we can have calculations. And since there are no elements inside our circles, we don’t have to have both a <cirlce> and a </circle> tag, although we could; we can have a single <circle /> tag.

That’s it in a nutshell, more details can be found here.
Now you might think: if I type that in my text editor, I’m almost certain I’ll get an error! Indeed, behind the scenes, there has to be some transformation for your browser to understand JSX. This magical operation is called transpilation. Transpilation is just what you’d hope it is, it turns code written how you like into code that the browser can interpret flawlessly. The flip side is that… well, you have to transpile your code.
If you work into environments like codepen or JsFiddle, they can take care of this for you. The most common transpiler is Babel. Babel turns your code into ES2015 compliant javascript (that is, before ES6). So the added bonus is that we can use any ES6 feature without wondering whether the user browser supports it or not. Most ES6 features are supported by the latest versions of many browswers, but there’s no guarantee that your users will run your favorite browser, let alone its latest version.
If you want to do this on your own, you’ll have to set up a build environment, we’ll cover this in the last two articles.


D3 and React – similarities and differences


Previous article: Visualization with React

d3, meet cousin React

Let’s not sugarcoat it: working with React is more complicated than with plain vanilla javascript. There are a few additional notions which may sound complex. But the good news is that if you come from the d3 world, there are many concepts which are similar. Visualization on the web is, at its core, transforming a dataset into a representation. That dataset is probably going to be an array, and at some point the framework will loop through the array and create something for each element of the array. For instance, if you want to make a bar chart, you probably will have at some point an array with one item that corresponds to each bar, which has a value that corresponds to its length. Looping through the array, each item is turned into a rectangle whose height depends on that value. That logic, which is at the core of d3 with selections, is also present in React. In d3, visualizations are essentially hierarchical. We start from an SVG element (probably), add to it elements like groups, which can hold other elements. To continue with our bar chart example, our chart will have several data marks attached to it (the bars), and there’s a hierarchical relation between them: the chart contains those marks. Our chart could be part of a dashboard that has several charts, or part of a web page that has other information. At any rate, in the d3 world, everything we create is added to a root element or to elements we create and arranged in a tree-like hierarchy. This is also the case in React, with a difference: the world of React is mostly structured into components. When that of d3 is mostly made of DOM elements like HTML or SVG elements, that of React is made of components. A React component is a part of your end result. It can be as small as a DOM element, or as big as the whole application. And it can have component children. So, components are logical ways to package your application. Components are created with modularity and reusability in mind. For instance, I can create a bar chart component in React, and the next time I have a bar chart to make, I can just reuse the exact same component. I can also create components to make axes or the individual bars in the chart, which my bar chart component will use. But the next time I need a bar chart, I wouldn’t have to think about it. In contrast, if I want to create another bar chart in d3, I probably have to recreate it from scratch and decide manually what happens to all the SVG or HTML elements that constitute the bar chart.

You say dAYta, I say da-tah

One fundamental way in which d3 and React differ is by how they treat data. If you read about React, you may find fancy terms like one-way data binding. In how many ways the data is bound in d3 is not something which is on top of our head when we create visualization so that might sound confusing. In d3, an element can modify the data which is associated to it. I’ve used it so many times.

See the Pen React simple scatterplot by Jerome Cukier (@jckr) on CodePen.

These bars have been made with a very simple dataset shown below them. If you click on the bars, the underlying data will change and the representation will change as well. In the world of React, when properties are passed to a component, they cannot be changed. That’s what one-way binding means. Data in React flows unidirectionally. Once it’s defined, it determines the way all components should be displayed. In certain events, a parent component can pass different properties to its children component and they may be re-rendered (we’ll see this in just a moment). But the important part is that properties passed to a component can never be changed. You may wonder: why is that even a good thing? React makes it impossible to do things! yes, but in the process it also makes things much safer. If properties can’t be changed, it also means that they can’t be altered by something we hadn’t thought of. Also, it makes it much easier to work on components independently: one team mate could make a bar chart component while her colleague makes a line chart. They don’t really need to know the inner working of the other component, and they know that nothing unexpected will disturb the way their component function.

The state of affairs

Components of React have a really powerful feature which doesn’t explicitly exist in d3: the state. The state represents the current status of a component. Here’s a simple switch component:

See the Pen React simple scatterplot by Jerome Cukier (@jckr) on CodePen.

We want to record the fact that the switch can be turned on or off. Here’s how it should work: First we create our switch component, and it’s supposed to be off. Then, if the user clicks it, it becomes on if it were off and vice-versa. And it should also be redrawn, to reflect that it’s been turned on (or off). The state does all that. It records the current status of the component. Technically, it’s an object with properties, so it can save a lot of information, not just a simple true or false value. The other great thing about the state is that if it changes, then the component is re-rendered. Rendering a component could require rendering children component, and they may be re-rendered as well. So with the state and properties, we have a powerful framework to handle events and whatever may happen to our app. If there’s an event we care about, it can change the state of a component, then, all of the children components may be re-rendered. And there’s no other way to redraw them. This is in contrast with plain d3 where anything goes – anything can change anything, data can be used to render elements, the underlying data can be changed without changing the element, the element can be transformed without changing the underlying data.

State is an important notion in computer science. In d3, it’s just doesn’t have a more formal representation than all the variables in your code.

In the next article in the series, an ES6 Primer, we will look in some useful ES6 features for React.


Visualization with React

Some back story…

In what seemed a lifetime ago now, I wrote tutorials to help people get started with Protovis as I learned it myself (it is indeed a lifetime away since Protovis is dead and buried for all intents and purposes). And a few years ago, I did the same for d3 as this started to become the most powerful visualization framework and for which documentation was still scarce. I wrote these tutorials to help me learn, but since then I have met many people who found them useful which blew my mind. By documenting my learning, I got noticed by Facebook and travelled 9000 miles to a new life.

At Facebook, I had some loosely-defined data visualization explorer role. While I joined during the infancy of React, I didn’t feel super comfortable using it then – I felt more effective writing one-off d3 applications. Eventually, I moved on and am now working at Uber as a fully-fledged data visualization engineer. I work almost exclusively with dashboards, which have a pretty elaborate UI.

Like in many other companies, at Uber, we use React for our web applications, including our visualizations, dashboards and maps. Increasingly, React is becoming the lingua franca of visualization: more than a tool that allows one to draw data, a mindset that informs how one should think a visualization. React is no longer a young library – the initial public release dates back from May 2013, and its very first application at Facebook was visualization (my first Facebook project, pages insights). There’s already many, many learning resources and tutorials for React. What I’ll try to do here is to show how React can be used for visualization: hopefully, this will be useful both for people who come from d3 and who’ve never worked with a web framework before, and for people who are familiar with React but who don’t know visualization well. That won’t be a complete and exhaustive guide, more a way to get started with references on how to go further.

The articles

I’ve structured this guide in 7 parts, and I’ll publish one per day:

  1. React vs D3, where we’ll explore similarities and differences between these two frameworks.
  2. An ES6 primer. I have written all the examples in good, sensible, modern ES6 javascript, because as of 2016 this is probably the most common syntax. Without going too deep into the details, I’ll explain what parts of the language I used for the examples, and how they differ from ES5.
  3. Gentle introduction to coding with React, where we’ll explore the high-level concepts of the framework and see how we can create visual elements from data. We’ll end on a presentation of JSX, a flavor of Javascript used to write React applications, which I’ll also use for most of the examples for the same reasons as ES6 – because it’s the most widespread way of writing React code today.
  4. React components, the most important concept in React and the building blocks of React applications.
  5. Beyond rendering. We’ll look at the React concept of lifecycle methods, and also how we can use d3 within React components.
  6. Creating a React visualization web app – using what we’ve seen, and two libraries – Facebook’s create-react-app and Uber’s React-vis, we’ll create a small standalone React visualization that can be deployed on its own website.
  7. The big leagues – in that last part, we’ll write together a more complex visualization with live data and several components interacting with one another.

The code

The examples of parts 1-5 can be found on codepen. I’ll add link to examples of part 6 and 7 when they go live.


You may not need d3

If you’re working on visualization on the web, the go-to choice is to use d3js (or a higher-level library). d3js is powerful and versatile. The best proof of that is the lead author of d3, Mike Bostock, worked until recently at the New York Times which many, including myself, consider the ultimate reference in terms of information graphics. At the NYT and elsewhere, d3js has powered breathtaking projects.

d3js was built as a successor to protovis. Protovis was a slightly higher-level library than d3js, more specialized in data graphics, and designed with the assumption that it could be used with little or no programming experience. And indeed this was true. When I started using protovis in 2009, my javascript skills were limited, and so I learned by deconstructing and recombining the examples. I kept on doing that when d3 came along – learning through examples. And the d3 examples, like those in protovis before, were short and standalone, demonstrating how easy it was to create something with a few lines of code.

d3js requires more technical knowledge than protovis did to get started, but not much. However, it is much more versatile – no longer constrained to charts and maps, it can handle a lot of the front-end functionalities of a web site. And so, it is possible to make visualizations by:

  • learning how to do stuff in d3js,
  • learning the essential javascript that you need to run d3js, as needed (i.e. variables, if-then statements, array methods…)
  • then, learning through doing, and obtain a feeling for how SVG, HTML and the Document Object Model works.

This approach is actually very limiting.

You would create much more robust code by:

  • learning javascript,
  • learning SVG/HTML/DOM,
  • then learning and appreciate d3 logic.

That would give you the choice when to use a d3js method, when to use another library (past, present or future), or when to use native javascript.

The point of this article is to go through the main functions of d3js and see how they can be replicated without using a library. As of this writing, I am convinced that using d3js is the most sensible way to handle certain tasks (though this may change in the future). In almost any case I can think of, even when it’s not the most efficient way to do so, using the d3js approach is the most convenient and the easiest from the developer’s perspective.  But I also believe it’s really important to know how to do all these things without d3js.

This will be a very long post. I’m trying to keep it as structured as possible so you can jump to the right section and keep it as a reference. This also assumes you have a certain familiarity with d3js and javascript – this is not an introductory post.

I’ve divided it in 4 parts:

  • Tasks that you really don’t need d3js for. And ok, you may want to use it regardless. But here’s how to do those things without it. (manipulating DOM elements)
  • interlude: a reflexion on d3js data binding. Do you really need that?
  • Tasks which are significantly easier with d3js (working with external data, animation)
  • Tasks where as of now, d3js is clearly superior to anything else (scales, array refactoring, map projections, layouts).

Selecting and manipulating elements

At the core of d3js is the notion of selection. In d3js, you select one or several elements which become a selection object. You can then do a variety of things:

  • join them with data, which is also an essential tenet of the d3 philosophy,
  • create or delete elements, especially in relation to the data you may have joined with their parent,
  • manipulate these elements by changing their attributes and their style, including in function of the data joined with each of them,
  • attach events listeners to those elements, so that when events happen (ie somebody clicks on a rectangle, or change the value of a form) a function might be triggered,
  • animate and transform those elements.

Selecting elements and parsing the DOM

d3 selection objects vs Nodes, HTML NodeList vs HTML LiveCollections

When you select something with d3js, using methods such as d3.select() or d3.selectAll(), this returns a d3 selection object. The selection object is a subclass of the javascript object Array – check here for all the nitty-gritty. The gist of it is that d3 selection objects can then be manipulated by d3 methods, such as .attr() or .style() to assign attributes or styles.

By contrast, the DOM is made of Node objects. The root of the DOM, the Document Object Model, is a special Node called Document. Nodes are organized in a tree-like structure: Document has children, which may have children etc. and encompass everything in the page. The Node objects are really the building blocks of a web page. When an element is added, be it an HTML element like a <div> or an SVG element like a <rect>, a new Node is created as well. So d3js has to interact with Node objects as well. d3 selection objects are tightly connected to their corresponding Node objects.

However, with “vanilla” javascript, you can directly access and manipulate the Node objects.

d3.select / d3.selectAll vs document.querySelector / document.querySelectorAll

In d3js, you parse the document using d3.select (to select one object) or d3.selectAll. The argument of this method is a CSS3 selector, that is, a string which is very similar to what could be found in a CSS style sheet to assign specific styles to certain situations. For instance, “g.series rect.mark” will match with all the rectangles of the class “mark” which are descendants of the SVG g groups of the class series.

When d3js was introduced in 2011, javascript didn’t have an equivalent syntax – instead you could select elements by class, or by id, or by tag name (more on that in a minute). Things have changed however and it is now possible to use CSS3 selectors using document.querySelector (which will return just one node) or document.querySelectorAll (which will return an HTML NodeList).

An HTML NodeList is a special object which is kind of like an array of Node objects, only it has almost no array methods or properties. You can still access its members using brackets, and get its length, but that’s it.

I wrote document.querySelectorAll, because you can use this method from the document, but you can use it from any Node. Those two snippets of code are parallel:

var svg = d3.select("svg"); // svg is a d3 selection object
var g = svg.selectAll("g"); // g is a d3 selection object
var svg = document.querySelector("svg"); // svg is a Node
var g = svg.querySelectorAll("g"); // g is a NodeList

 Getting elements by class name, ID, tag name, name attribute

d3js doesn’t have a special way to get all descendants of a selection of a certain class, of a certain ID, etc. The CSS3 selector syntax can indeed handle all those cases, so why have a separate way?

By contrast, javascript pre-2011 didn’t have a querySelectorAll method, and so the only way to parse the document was to use more specific method, like document.getElementsByClassName().

document.getElementsByClassName() retrieves all descendants of a certain class. document.getElementsByName() retrieves elements with a certain “name” attribute (think forms). documents.getElementsByTagName() gets all descendants of a certain type (ie all <div>s, all <rect>s, etc.).

What’s interesting about that is that what is returned is not an HTML NodeList like above with querySelectorAll, but another object called HTML Live Collection. The difference is that matching elements are created after, they would still be included in the Live Collection.

var svg = d3.select("svg");
svg.selectAll("rect").data([1,2,3]).enter().append("rect");
var mySelection = svg.selectAll("rect"); // 3 elements
mySelection[0].length // 3
svg.append("rect");
mySelection[0].length // 3
mySelection = svg.selectAll("rect"); // re-selecting to update it
mySelection[0].length // 4
var svg = document.querySelector("svg");
var ns = "http://www.w3.org/2000/svg";
var i;
for (i = 0; i < 3; i++) {
  var rect = document.createElementNS(ns, "rect"); // we'll explain creating elements later
  svg.appendChild(rect);
}
var mySelection = svg.getElementsByTagName("rect"); // 3 elements
var rect = document.createElementNS(ns, "rect");
svg.appendChild(rect);
mySelection.length // 4 - no need to reselect to update

How about IDs? there is also the getElementById (no s at elements!) which only retrieve one element. After all, IDs are supposed to be unique! if no elements match, getElementById returns null.

Children, parents, siblings…

Truth be told, if you can use selectors from the root, you can access everything. But sometimes, it’s nice to be able to go from one node to its parents or its children or its siblings, and d3js doesn’t provide that. By contrast, the Node object has an interface that does just that – node.childNodes gets a nodeList of child nodes, node.parentNode gets the parent node, node.nextSibling and node.previousSibling get the next and previous siblings. Nice.

However, most often you will really be manipulating elements (more on that in a second) and not nodes. What’s the difference? all Elements are Nodes, but the reverse is not true. One common example of Node which is not an Element is text content.

To get an Element’s children, you can use the (wait for it) children property. The added benefit is that what you get through children is a LiveCollection (dynamic), while what you get through childNodes is a NodeList (static).

var svg = document.querySelector("svg");
var ns = "http://www.w3.org/2000/svg";
var i;
for (i = 0; i < 3; i++) {
  var myRect = document.createElementNS(ns, "rect"); // we'll explain creating elements later
  svg.appendChild(rect);
}
// the variable myRect holds the last of the 3 <rect> elements that have been added
svg.childNodes; // a NodeList
myRect.parentNode; // the svg element
myRect.nextSibling; // null - myRect holds the last child of svg.
myRect.previousSibling; // the 2nd <rect> element
svg.firstChild; // the 1st <rect>. Really useful shorthand
svg.querySelector("rect"); // also the 1st <rect>.
svg.children; // a LiveCollection

Adding/reading attributes, styles, properties and events

Node, Element, EventTarget and other objects

In d3 101, right after you’ve created elements (to which we’ll come in a moment), you can start moving them around or giving them cool colors like “steelblue” by using the .attr and .style methods.

Wouldn’t that be cool if we could do the same to Node objects in vanilla javascript!

Well, we can. Technically, you can’t add style or attributes to Node objects proper, but to Element objects. The Element object inherits from the Node objects and is used to store these properties. There is also an HTMLElement and SVGElement which inherit from the Element object.

If you look at the Chrome console at an SVG element like a rect, you can see, in the properties tab, all the objects it inherits from: Object, EventTarget, Node, Element, SVGElement, SVGGraphicsElement, SVGGeometryElement, SVGRectElement, rect.

All have different roles. To simplify: Node relates to their relative place in the document hierarchy, EventTarget, to events, and Element and its children, to attributes, style and the like. The various SVG-prefixed objects all implement specific methods and properties. When we select a Node object as we’ve done above with svg.querySelector(“rect”) and the like, note that there’s not a Node object on one side, then an Element object somewhere else, a distinct SVGGeometryElement, and so on and so forth. What is retrieved is one single object that inherits all methods and properties of Nodes, Elements, EventTargets, and so on and so forth, and, as such, that behaves like a Node, like an Element, etc.

Setting and getting attributes

You can set attributes with the Element.setAttribute method.

var rect = document.querySelector("rect");
rect.setAttribute("x", 100);
rect.setAttribute("y", 100);
rect.setAttribute("width", 100);
rect.setAttribute("height", 100);

To be honest, I’m a big fan of the shorthand method in d3js,

var rect = d3.select("rect");
rect.attr({x: 100, y: 100, width: 100, height: 100});

Also, the Element.setAttribute method doesn’t return anything, which means it can’t be chained (which may or may not be a bad thing, though it’s definitely a change for d3js users). It’s not possible to set several attributes in one go either, although one could create a custom function, or, for the daring, extend the Element object for that.

Likewise, the Element object has a getAttribute method :

rect.getAttribute("x"); // 100

Classes, IDs and tag names

Classes, IDs and tag names are special properties of the Element objects. It’s extremely common to add or remove classes to elements in visualization: my favorite way to do that is to use the classed method in d3js.

d3.select("rect").classed("myRect", 1)

In vanilla javascript, you have the concept of classList.

document.querySelector("rect").classList; // ["myRect"]

ClassList has a number of cool methods. contains checks if this Element is of a certain class, add adds a class, remove removes a class, and toggles, well, toggles a class.

document.querySelector("rect").classList.contains(["myRect"]); // true
document.querySelector("rect").classList.remove("myRect");
document.querySelector("rect").classList.add("myRect");
document.querySelector("rect").classList.toggle("myRect");

How about IDs ? with d3js, you’d have to treat them as any other property (rect.attr(“id”)). In vanilla javascript, however, you can access it directly via the id property of Element. You can also do that with the name property.
Finally, you can use the tagName to get the type of element you are looking at (though you cannot change it – you can try, it just won’t do anything).

document.querySelector("rect").id = "myRect"; // true
document.querySelector("rect").name; // undefined;
document.querySelector("rect").tagName; // "rect"
document.querySelector("rect").tagName = "circle";
document.querySelector("rect").tagName; // "rect"

Text

Text is a pretty useful aspect of visualization! it is different from attributes or styles, which are set in the opening tag of an element. The text or content is what is happening in between the opening and closing tags of that element. This is why, in d3js, text isn’t set using attr or style, but either by the html method for HTML elements like DIVs or Ps, or by the text method for SVG elements like <text> and <tspan>.

Those have equivalent in the DOM + javascript world.

HTMLelements have the .innerHTML and outerHTML properties. The difference between the two is that outerHTML includes the opening and closing tags. innerHTML and outerHTML both return HTML, complete with tags and syntax.

SVG elements, however, don’t have access to this property, so they have to rely on the Node property textContent. HTML elements also have access to it, by the way. textContent returns just the plain text content of what’s in the element. All three properties can be used to either get or set text.

Style

In d3js, setting styles to elements is very similar to setting attributes, only we use the .style method instead of the .attr one. It’s so much similar that it’s a rather common mistake to pass as attribute what should be a style and vice-versa! Like with attributes, it is possible to pass an object with keys and values to set several style properties at once.

d3.selectAll("rect").style("fill", "red");
d3.selectAll("rect").style({stroke: "#222", opacity: .5});

In the world of DOM and vanilla javascript, style is a property of the HTMLElement / SVGElement objects. You can set style properties one at a time:

rect = document.querySelector("rect");
rect.style.fill = "red";
rect.style.stroke = "#222";
rect.style.opacity = .5;

Technically, .style returns a CSSStyleDeclaration object. This object maintains a “live” link to what it describes. So:

myStyle = rect.style;
rect.style.fill = "yellow";
myStyle.fill; // "yellow"

Finally, the window object has a getComputedStyle method that can get the computed styles of an element, ie how the element is actually going to get drawn. By contrast, the style property and the d3js style method only affect the inline styles of an element and are “blind” to styles of its parents.

myStyle = window.getComputedStyle(rect, null);
myStyle.fill; // "yellow"

Adding and removing events

In d3js, we have the very practical method “on” which let users interact with elements and can trigger behavior, such as transformations, filtering, or, really, any arbitrary function. This is where creating visualizations with SVG really shines because any minute interaction with any part of a scene can be elegantly intercepted and dealt with. Since in d3js, elements can be tied with data, the “on” methods takes that into account and passes the data element to the listener function. One of my favorite tricks when I’m developing with d3js and SVG is to add somewhere towards the end the line:

d3.selectAll("*").on("click", function(d) {console.log(d);})

Which, as you may have guessed, displays the data item tied to any SVG element the user could click on.

In the world of the DOM, the object to which events methods are attached in the EventTarget. Every Element is also an EventTarget (and EventTarget could be other things that handle events too, like xhr requests).

To add an event listener to an element, use the addEventListener method like so.

document
  .querySelector("rect")
  .addEventListener("click", function() {
     console.log("you clicked the rectangle!"
   }, false);

The first parameter is the type of event to listen to (just as in “on”), the second is the listener function proper. The third one, “use capture”, a Boolean, is optional. If set to true, it stops the event from propagating up and being intercepted by event listeners of the parents of this element.

There is also a “removeEventListener” method that does the opposite, and needs the same elements: in other words, yes, you need to pass the same listener function to be able to stop listening to the element. There is no native way to remove all event listeners from an element, although there are workarounds.

Creating and removing elements

Selecting and modifying elements is great, but if you are creating a visualization, chances are that you want to create elements from scratch.

Let’s first talk about how this is done in the DOM/javascript, then we’ll better understand the data joins and d3 angle.

Node objects can exist outside of the hierarchy of the DOM. Actually, they must first be created, then be assigned to a place in the DOM.

Until a Node object is positioned in the DOM, it is not visible. However, it can receive attributes, styles, etc. Likewise, a Node object can be taken from the DOM, and still manipulated.

To create an HTML element, we can use the document.createElement() method:

var myDiv = document.createElement("div");

However, that won’t work for SVG elements – remember in an earlier example, we used the createElementNS method. This is because SVG elements have to be created in the SVG namespace. d3js old-timers may remember that in the first versions, we had to deal with namespaces when creating elements in d3js as well, but now this all happens under the hood.

Anyway, in vanilla javascript, this is  how it’s done:

var svgns = "http://www.w3.org/2000/svg";
var myRect = document.createElementNS(svgns, "rect");

Warning, because document.createElement(“rect”) will not produce anything useful as of this writing.

Once the new Node objects are created, in order to be visible, they should be present in the DOM. Because the DOM is a tree, this means that they have to have a parent.

svg.appendChild(myRect);

Likewise, to remove a Node from the DOM means to sever that relationship with its parent, which is done through the removeChild method:

svg.removeChild(myRect);

Again, even after a Node has been removed, it can still be manipulated, and possibly re inserted at a later time.

Nodes don’t remove themselves, but you can write:

myRect.parentNode.removeChild(myRect);

In contrast, here is how things are done in d3js.

The append method will add one element to a parent.

d3.select("svg").append("rect");

The remove method will remove one entire selection object from the DOM.

d3.select("svg").selectAll("rect").remove(); // removes all rect elements which are children of the SVG element

But the most intriguing and the most characteristic way to create new elements in d3js is to use a data join.

d3.select("svg")
  .selectAll("rect")
  .data(d3.range(5))
  .enter()
  .append("rect");

The above snippet of code counts all the rect children of the svg element, and, if there are fewer than 5 – the number of items in d3.range(5), which is the [0,1,2,3,4] array – creates as many as needed to get to 5, and binds values to those elements – the contents of d3.range(5) in order. If there are already 5 rect elements, no new elements will be created, but the data assignment to the existing elements will still occur.

Data joins, or the lack thereof

The select / selectAll / data / enter / append sequence can sound exotic to people who learn d3js, but to its practitioners, it is its angular stone. Not only is it a quick way to create many elements (which, in vanilla javascript, takes at least 2 steps. Creating them, and assigning them to the right parent), but it also associates them with a data element. That data element can then be accessed each time the element is being manipulated, notably when setting attributes or styles and handling events.

For instance,

d3.selectAll("rect")
  .attr("x", function(d) {return 20 * d;});

the above code utilizes the fact that each of the rectangle have a different number associated with them to dynamically set an attribute, here position rectangles horizontally.

d3.selectAll("rect")
  .on("click", function(d) {console.log(d);})

A trick I had mentioned above, but which illustrates this point: here by clicking on each rectangle, we use the data join to show the associated data element.

Having data readily available when manipulating elements in d3js is extremely convenient. After all, data visualization is but the encoding of data through visual attributes. How to perform this operation without the comfort of data joins?

Simply by going back to the dataset itself.

Consider this:

var data = [];
var i;
for (i = 0; i < 100; i++) {
  data.push({x: Math.random() * 300, y: Math.random() * 300}); // random data points
}

// d3 way
var d3svg = d3.select("body").append("svg");
d3svg.selectAll("circle").data(data).enter().append("circle")
  .attr({cx: function(d) {return d.x;}, cy: function(d) {return d.y}, r: 2})
  .style({fill: "#222", opacity: .5});

// vanilla js way
var svgns = "http://www.w3.org/2000/svg";
var svg = document.createElementNS(svgns, "svg");
document.querySelector("body").appendChild(svg);
for (i = 0; i < 100; i++) {
  var myCircle = document.createElementNS(svgns, "circle");
  myCircle.setAttribute("cx", data[i].x);
  myCircle.setAttribute("cy", data[i].y);
  myCircle.setAttribute("r", 2);
  myCircle.style.fill = "#222";
  myCircle.style.opacity = .5;
  svg.appendChild(myCircle);
}

See the Pen eNzaYg by Jerome Cukier (@jckr) on CodePen.

Both codes are equivalent. Vanilla JS is also marginally faster, but d3 code is much more compact. In d3js, the process from dataset to visual is:

  • Joining dataset to container,
  • Creating as may children to container as needed, [repeat operation for as many levels of hierarchy as needed],
  • Use d3 selection objects to update the attributes and styles of underlying Node objects from the data items which have been joined to them.

    In contrast, in vanilla Javascript, the process is:

  • Loop over the dataset,
  • create, position and style elements as they are read from the dataset.

For visuals with a hierarchy of elements, the dataset may also have a hierarchy and could be nested. In this case, there may be several nested loops. While the d3js code is much more compact, the vanilla approach is actually more simple conceptually. Interestingly, this is the same logic that is at play when creating visualization with Canvas or with frameworks like React.js. To simply loop over an existing, invariant dataset enables you to implement a stateless design and take advantage of immutability. You don’t have to worry about things such as what happens if your dataset changes or the status that your nodes are in before creating or updating them. By contrast most operations in d3js assume that you are constantly updating a scene on which you are keeping tabs. In order to create elements, you would first need to me mindful on existing elements, what data is currently associated with them, etc. So while the d3js approach is much more convenient and puts the data that you need at your fingertips, the vanilla JS approach is not without merits.

Loading files

The first word in data visualization is data, and data comes in files, or database queries. If you’re plotting anything with more than a few datapoints, chances are you are not storing them as a local variable in your javascript. d3js has a number of nifty functions for that purpose, such as d3.csv or d3.json, which allow to load the files asynchronously. The trick in working with files is that it can take some time, so some operations can take place while we wait for the files to load, but some others really have to wait for the event that the file is loaded to start. I personally almost always use queue.js, also from Mike Bostock, as I typically have to load data from several files and a pure d3 approach would require nesting all those asynchronous file functions. But, for loading a simple csv file, d3js has a really simple syntax:

d3.csv("myfile.csv", function(error, csv) {
  // voila, the contents of the file is now store in the csv variable as an array
})

For reference, using queue js, this would look like

queue()
 .defer(d3.csv, "myFirstFile.csv")
 .defer(d3.csv, "mySecondFile.csv")
 .await(ready);

function ready(error, first, second) {
  // the contents of myFirstFile is stored as an array in the variable "first",
  // and the contents of mySecondFile are in the variable "second".
}

The way to do the equivalent in vanilla Javascript is to use XMLHttpRequest.

function readFile() {
  var fileLines = this.responseText.split("\n");
  var fields = fileLines[0].split(",");
  var data = fileLines.slice(1).map(function(d) {
    var item = {};
    d.split(",").forEach(function(v, i) {item[fields[i]] = v;})
    return item;
  })

  var request = new XMLHttpRequest();
  request.onload = readFile;
  request.open("get", "myFile.csv", true);
  request.send();

The syntax of loading the file isn’t that cumbersome, and there are tons of nice things that can be done through XMLHttpRequest(), but let’s admit that d3js/queue.js functions make it much more comfortable to work with csv files.

Animations

d3js transitions is one of my favorite part of the library. I understand it’s also one the things which couldn’t be done well in protovis and which caused that framework to break. It feels so natural: you define what you want to animate, all that needs to change, the time frame and the easing functions, and you’re good to go (see my previous post on animations and transitions). In native javascript, while you can have deep control of animations, it’s also, unsurprisingly, much more cumbersome. However, CSS3 provides an animation interface which is comparable in flexibility, expressiveness and ease of use to what d3js does. First let’s get a high-level view of how to do this entirely within JS. Then let’s get a sense of what CSS can do.

requestAnimationFrame and animation in JavaScript

JavaScript has timer functions, window.setTimeout and window.setTimeinterval, which let you run some code after a certain delay or every so often, respectively. But this isn’t great for animation. Your computer draws to screen a fixed number of times per second. So if you try to redraw the same element several times before in between those times, it’s a waste of resources! What requestAnimationFrame does is tell your system to wait for the next occasion to draw to execute a given function. Here’s how it will look in general.

function animate(duration) {
  var start = Date.now();
  var id = requestAnimationFrame(tick);
  function tick() {
    var time = Date.now();
    if (time - start < duration) {
       id = requestAnimationFrame(tick);
       draw(time - start / duration);
    } else {
      cancelAnimationFrame(id);
    }
  }
  function draw(frame) {
    // do your thing, update attributes, etc.
  }
}


See the Pen PqzgLV by Jerome Cukier (@jckr) on CodePen.

OK so in the part I commented out, you will do the drawing proper. Are you out of the woods yet? well, one great thing about d3js transitions is that they use easing functions, which transform a value between 0 and 1 into another value between 0 and 1 so that the speed of the animation isn’t necessarily uniform. In my example, you have (time – start) / duration represents the proportion of animation time that has already elapsed, so that proportion can be further transformed.

So yay we can do everything in plain javascript, but that’s a lot of things to rewrite from scratch.

CSS3, animations and transitions

(This is not intended to be an exhaustive description of animations and transitions, a subject on which whole books have been written. Just to give those who are not familiar with it a small taste).

In CSS3, anything you can do with CSS, you can time and animate. But there are some caveats.

There are two similar concepts to handle appearance change in CSS: animations and transitions. What is the difference?

  • with animations, you describe a @keyframes rule, which is a sequence of states that happen at different points in time in your transition. In each of these events, any style property can be changed. The animation will transform smoothly your elements to go from one state to the next.
  • in transitions, you specify how changes to certain properties will be timed. For instance, you can say that whenever opacity changes, that change will be staged over a 1s period, as opposed to happen immediately.

Both approaches have their uses. CSS3 animations are great to create complex sequences. In d3js, that requires to “chain transitions”, which is the more complex aspect of managing them. By contrast, going from one segment of the animation to another is fairly easy to handle in CSS3. Animations, though, require the @keyframes rule to be specified ahead of time in a CSS declaration file. And yes, that can be done programmatically, but it’s cumbersome and not the intent. The point is: animations work better for complex, pre-designed sequence of events.

Transitions, in contrast, can be set as inline styles, and work fine when one style property is changed dynamically, a scenario which is more likely to happen in interactive visualizations.

Here’s how they work. Let’s start with animations.

See the Pen vOKKYN by Jerome Cukier (@jckr) on CodePen.

Note: as of this writing, animation-related CSS properties have to be vendor prefixed, i.e. you have to repeat writing these rules for the different browsers. Here’s a transition in action.

See the Pen xGOqOR by Jerome Cukier (@jckr) on CodePen.

For transition, you specify one style property to “listen” to, and say how changes to that property will be timed, using the transition: name of property + settings. (in the above example: transition: transform ease 2s means that whenever the “transform” style of that element changes, this will happen over a 2s period with an easing function). 

One big caveat for both CSS animations and transitions is that they are limited to style properties. In HTML elements this is fine because everything that is related to their appearance is effectively handled by style: position, size, colors, etc. For SVG, however, color or opacity are styles, like in HTML, but positions, sizes and shapes are attributes, and can’t be directly controlled by CSS. There is a workaround for positions and sizes, which is to use the transform style property.

But wait: isn’t transform an SVG attribute as well? that’s right. And that’s where it can get really confusing. Many SVG elements are positioned through x and y properties (attributes). They can also have a transform property which is additive to that. For instance, if I have a <rect> which has an x property of 100 and a transform set at “translate(100)”, it will be positioned 200px right of its point of origin. But on top of that, SVG elements can have a transform style which affects pretty much the same things (position, scales, rotation…) but which has a slightly different syntax (“translate(100)”, for instance, wouldn’t work, you’d have to write “translateX(100px)”). What’s more, the transform set in the style doesn’t add to the one set in the properties, but it overrides it. If we add a “transform: translateX(50px)” to our <rect>, it will be positioned at 150px, not 200px or 250px. Another potential headache is that some SVG elements cannot support transform styles.
While any of these properties can be accessed programmatically, managing their potential conflicts and overlaps can be difficult. In the transition example above, I have used the transform/translateX syntax.

That said, a lot of awesome stuff can be done in CSS only. For scripted animations, the animation in pure CSS is definitely more powerful and flexible than the d3js equivalent, however, when dealing with dynamically changing data, while you can definitely handle most things through CSS transitions, you’ll appreciate the comfort of d3js style transitions.

See the Pen GJqrLO by Jerome Cukier (@jckr) on CodePen.

Now a common transformation handled by d3js transitions is to transform the shape of path shapes. This is impossible through CSS animations/transitions, because the shape of the path – the “d” – is definitely not a style property. And sure, we can use a purely programmatic approach with requestAnimationFrame but is there a more high level way?
It turns out there actually is – the animation element of SVG, or SMIL. Through SMIL, everything SVG can be animated with an interface, this includes moving an object along a path, which I wouldn’t know how to do on top of my head in d3js. Here is an extensive explanation of how this works and what can be done.

Data processing, scales, maps and layouts

For the end of the article let’s talk about all of which could technically be done without d3js, but in a much, much less convenient way. Therefore, I won’t be discussing alternatives with vanilla Javascript, which would be very work intensive and not necessarily inventive.

Array functions and data processing

d3js comes with a number of array functions. Some are here for convenience, such as d3.min or d3.max which can easily be replaced by using the native reduce method of arrays. When comparing only two variables, d3.max([a, b]) is not much more convenient than Math.max(a,b) or a > b ? a : b.

Likewise, d3js has many statistical functions, which saves you the trouble to implement them yourself if you need them, such as d3.quantile. There are other libraries who do that, but they’re here and it’s really not useful to recode that from scratch.

d3js comes with shims for maps and sets, which will be supported by ES6. By now, there are transpilers which can let you use ES6 data structures. But it’s nice to have them.

In my experience, d3js most useful tool in terms of data processing is the d3.nest function, which can transform an array of objects into a nested object. (I wrote this article about them).  Underscore has something similar. While you can definitely getting a dataset of any shape and size by parsing an array and performing any grouping or operations manually, this is not only very tedious but also extremely error prone.

Scales

Scales are one superb feature of d3js. They are simple to understand, yet very versatile and convenient. Oftentimes, d3 scales, especially the linear ones, are a replacement for linear algebra.

d3.scale.linear().range([100, 500]).domain([0, 24])(14);
((14 - 0) / (24 - 0)) * (500 - 100) + 100; // those two are equivalent (333.33...)

but changing the domain or the range of a scale is much safer using the scale than adhoc formulas. Add to this scale goodness such as the ticks() method or nice() to round the domain, and you get something really powerful.

So, of course it is possible (and straightforward, even) to replace the scales but that would be missing out one of the best features of d3js.

Maps

d3js comes with a full arsenal of functions and methods to handle geographic projections, ie: the transformation of longitude/latitude coordinates into x,y positions on screen. Those come in two main groups, projections proper that turn an array of two values (longitude, latitude) into an array of two values (x, y). There are also paths functions that are used to trace polygons, such as countries, from specially formatted geographic files (geoJSON, topoJSON).

The mercator projection may be straightforward to implement, But others are much less so. The degree of comfort that d3js provides when visualizing geographical data is really impressive.

Layouts

d3js layouts, that is special visual arrangements of data, were in my opinion one of the key drivers of protovis (where they originated) then d3js adoption. Through layouts, it became simple to create, with a few line of codes, complex constructions like treemaps or force-directed networks. Some layouts, like the pie chart or the dendogram, are here for convenience and could be emulated. Others, and most of all the force layout, are remarkably implemented, efficient and versatile. While they are called different names in d3js, geometry functions such as voronoi tessellation or convex hulls are similar functionally and there is little incentive in reproducing what they do in plain javascript.

Should I stop using d3?

d3js is definitely the most advanced javascript visualization library. The point of this article is not to get you to stop using it, but rather, to have a critical thinking in your code. Even with the best hammer, not everything is a nail.

To parse the DOM, manipulate classes and listen to events, you probably don’t need a library. The context of your code may make it more convenient to use d3 or jQuery or something else, but it’s useful to consider alternatives.
The concept of the data join unlocks a lot of possibilities in d3js. A good understanding of data join would lead you to implement your visualization much faster, using more concise code and replicable logic. It also makes trouble shooting easier. Data joins are especially useful if you have a dataset which is structured like your visualization should be, or if you plan to have interaction with your visualization that requires quick access with the underlying data. However, data joins are not necessary in d3js, or in visualization in general. In many cases, it’s actually perfectly sensible to parse a dataset and create a visual representation in one fell swoop, without attaching the data to its representation or overly worrying about updating.

Assuming you have d3js loaded, nothing prevents you from creating elements using d3js append methods instead of vanilla javascript. Or to listen to events using addEventListener rather than with d3js on method. It’s totally ok to mix and match.

Like data joins, transitions are a very powerful component of d3js, and, once you’re comfortable with them, they are very expressive. There are other animation frameworks available though, which can be better adapted to the task at hand.
Scale, maps, layouts and geometries are extremely helpful features however and I can think of no good reason to reimplement them.

Credit where it’s due

To write this I drew inspiration from many articles and I will try to list them all here.
The spark that led me to write was Lea Verou’s article jQuery considered harmful, as well as articles she cites (you might not need jQuery, you don’t need jQuery, Do you really need jQuery?, 10 tips for writing JavaScript without jQuery).

Most of the information I used especially in the beginning of the article comes more or less directly from MDN documentation, and direct experimentation. For CSS and animation, I found the articles of Chris Coyier (such as this one or this one) and Sara Soueidan (here) on CSS Tricks to be extremely helpful. Those are definitely among the first resources to check out to go deeper on the subject. Sara was also the inspiration behind my previous post, so thanks to her again!

Finally, I’ve read Replacing jQuery with d3 with great interest (like Fast interactive prototyping with d3js and sketch about a year ago). It may seem that what I write goes in the opposite direction, but we’re really talking about the same thing -that there are many ways to power front ends and that it’s important to maintain awareness of alternative methods.
 

Blending mode and SVG

One great thing about canvas is that it’s super easy to change the compositing mode. And sure, you can do all sorts of fancy things with that, but my basic usage of that is to control how opacity is handled. By default, in svg, if you add one element which is not fully opaque on top of another, the top element makes the bottom element darker. By contrast, in canvas you can have access to globalCompositeOperation that let you change how new elements drawn on top of an existing image are handled, or in processing, you have blendMode, etc.

In SVG, there are a variety of operations accessible through filters: see http://apike.ca/prog_svg_filters.html for an excellent overview. I must admit that I find filters a bit intimidating to set up and need to always go back to a reference to achieve anything.

I was reading this article this morning on CSS graphical effects http://blogs.adobe.com/dreamweaver/2015/04/an-introduction-to-graphical-effects-in-css.html thinking, wouldn’t that be nice if we could do control compositing in SVG.

It turns out that we can! By manipulating the “mix-blend-mode” style attribute of any graphical element, we can achieve one of 16 blending modes (which is actually more than canvas or processing!)
Here’s a demo that shows what can be done. This is an adaptation of this example.

So, through the use of the right blending mode, opacity can be used to make the resulting image lighter (among many other things).


New personal project: slopes of San Francisco

Hi, it’s been a while since I last posted!
Here is a new project using publicly available data: slopes of San Francisco.

As a San Franciscan who likes to walk, I’m confronted to a common problem. Most cities, such as Paris where I’m from, are mostly flat. So, in order to go one block east and one block north of where I am standing, I can go North then East or East then North: this is mostly equivalent (except that streets never meet at a right angle in Paris but that’s another problem). In San Francisco, going North then East can mean climbing a huge hill then down, versus walking on a flat surface. Itineraries matter, and often times I found myself going through mountains and valleys just because I thought the straight line was the simplest way to go from A to B.

Which is why I wanted to create a map of streets by slope, to help me (and my fellow San Franciscans) figure out which streets are practicable, and which should be avoided.

Here’s how I did it.

Getting the data

To compute slopes, I needed elevation data and the most convenient way to obtain it is through google elevation API. This API takes one or several points (longitude and latitude) and returns an elevation. Now which points was I going to feed it?

I started by the San Francisco metro extract from Open Street Map. What you get is an XML file which has a list of nodes with longitudes and latitudes, and a list of structures that connect them (such as landmass, streets, buildings, etc.). Now the problem was that the file I used had some 1.4m nodes, and Google Elevation API limits are 25000 locations per 24 hour period.

So my first task was to figure out how many of those 1.4m nodes I really needed. Turns out that the metro extract covers much more than the city but also the whole bay area. So my first pass was to filter out nodes that were outside a bounding box. Then, I only kept nodes that were part of a street, and furthermore, only the ones that would be either at the end of one street or at an intersection. By doing so, I’m assuming that all streets are straight between any two intersections, which is far from true, but would do for our purposes. I applied further filtering to weed out streets that were made of just one node. Eventually, I arrived at just over 10000 nodes! and in the process, I also extracted from the XML file the shape of the streets, that is, in which order nodes appeared in those streets. After several iterations in my code, I also scrapped their number of lanes when available and the street names.

Sanity check

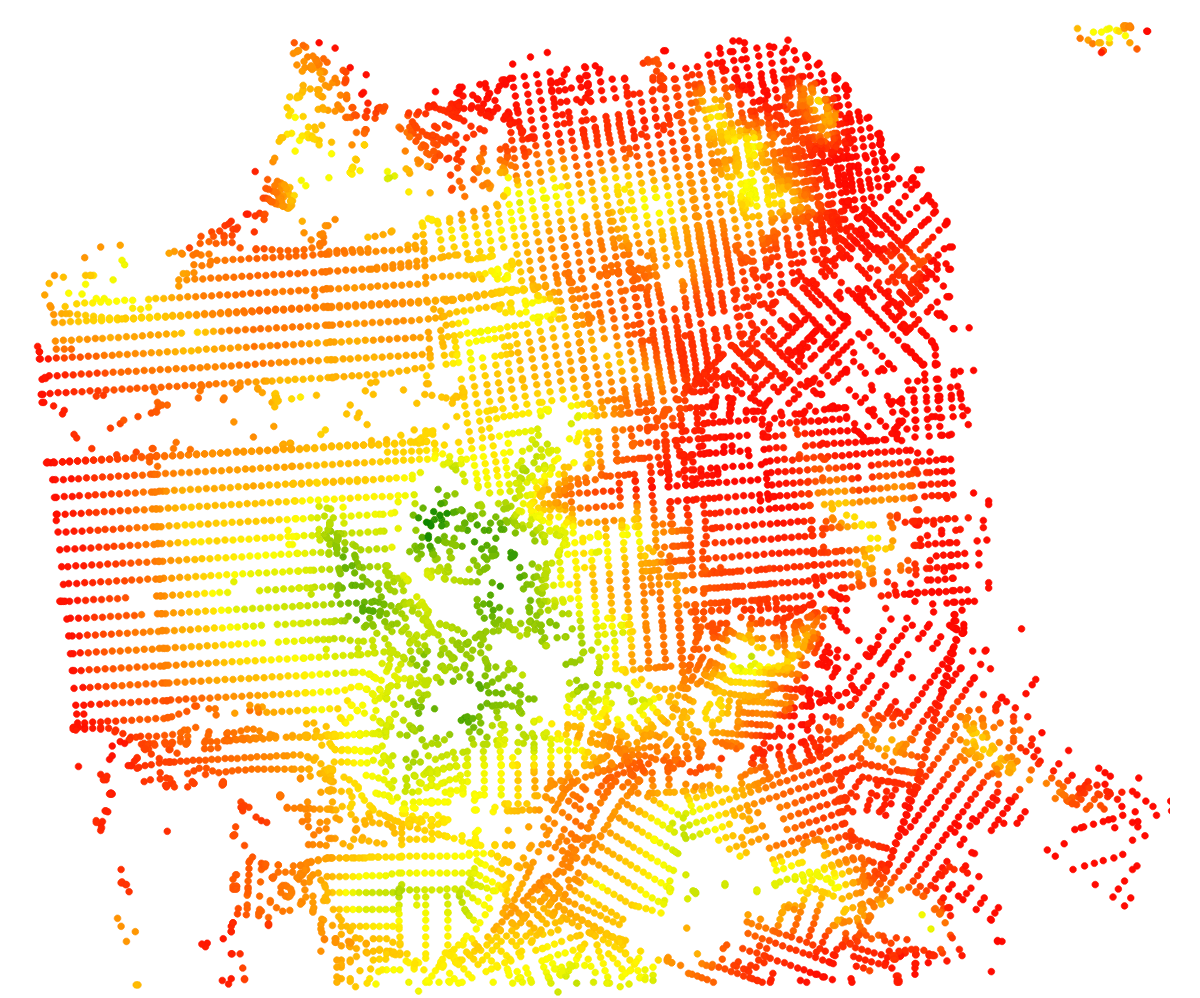
The first thing I did was to plot my nodes on a map.

First draft

First draft

Looks ok. So next, I just drawed my streets. I did that using d3, and each of my streets in this next iteration is a single path object.


First network of streets

First network of streets

So that’s a basic node-and-link mesh of San Francisco, the problem with that approach is that I can only style one street (i.e. the links between the nodes) as a whole. However, what I wanted to highlight was where the streets were steep: many streets just go up and down, so giving them a single “steepness” rating wasn’t going to cut it.

Encoding steepness

Segments of streets

Segments of streets

The next logical step was to draw each of the edges individually (this time, they are lines, not paths). There are 6000+ “streets” (in the OSM sense – streets can be split in any number of different entities in Open Street Map), versus about 16000 different edges. I also found I didn’t really need to draw the nodes.

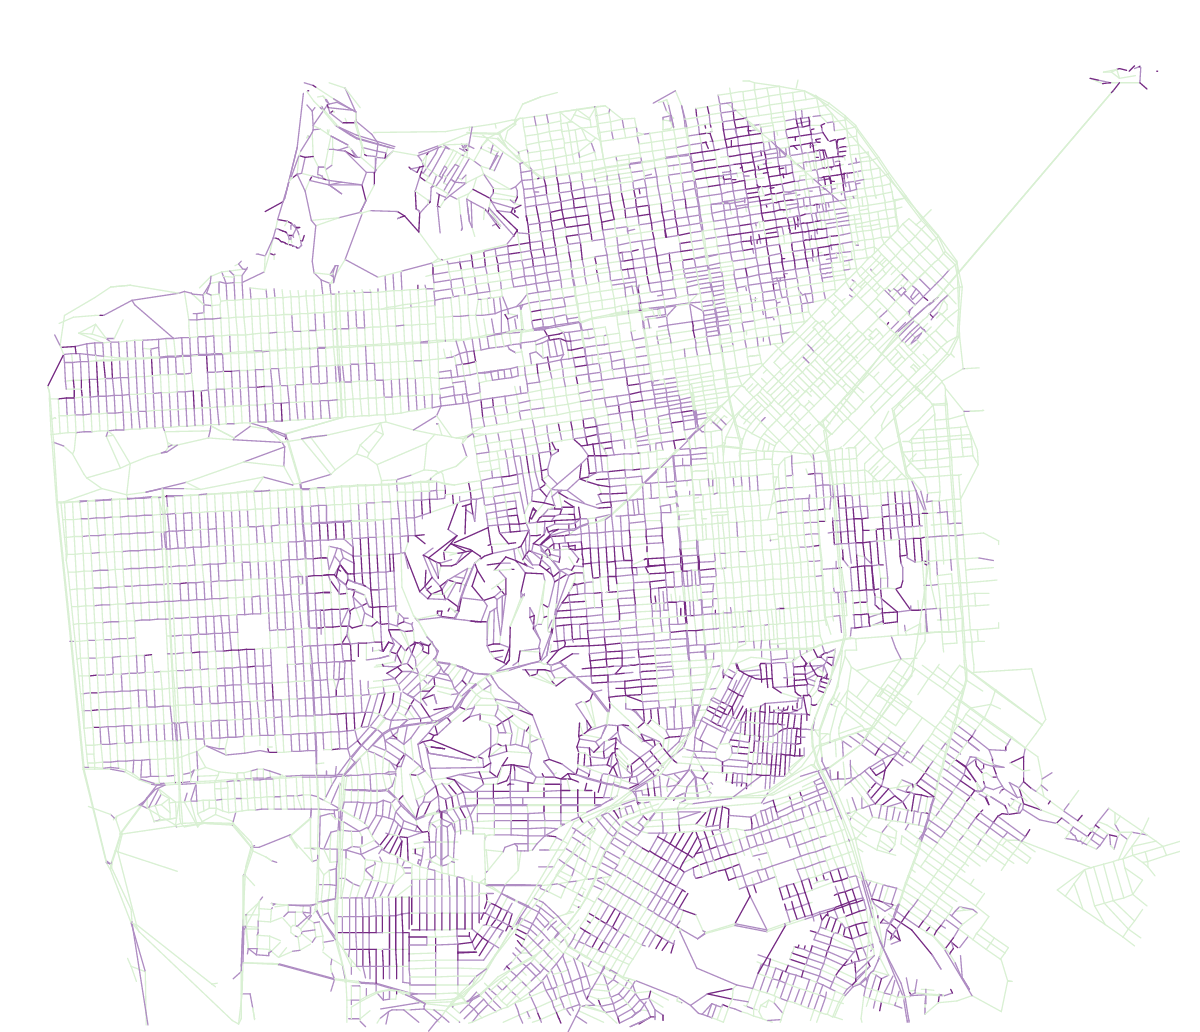
The obvious way was to encode steepness from green to red on a linear scale. That looks ok, but that’s not super interesting because it’s very difficult to tell whether one street is steeper than another just by comparing colors. I didn’t need an infinite variation of colors, I just wanted to know whether a street was flat (or quasi-flat), with a noticeable slope, or really steep. So instead of using a full linear scale, I just used 3 colors from the green – purple colorbrewer scale.

Same map with discrete colors

Same map with discrete colors

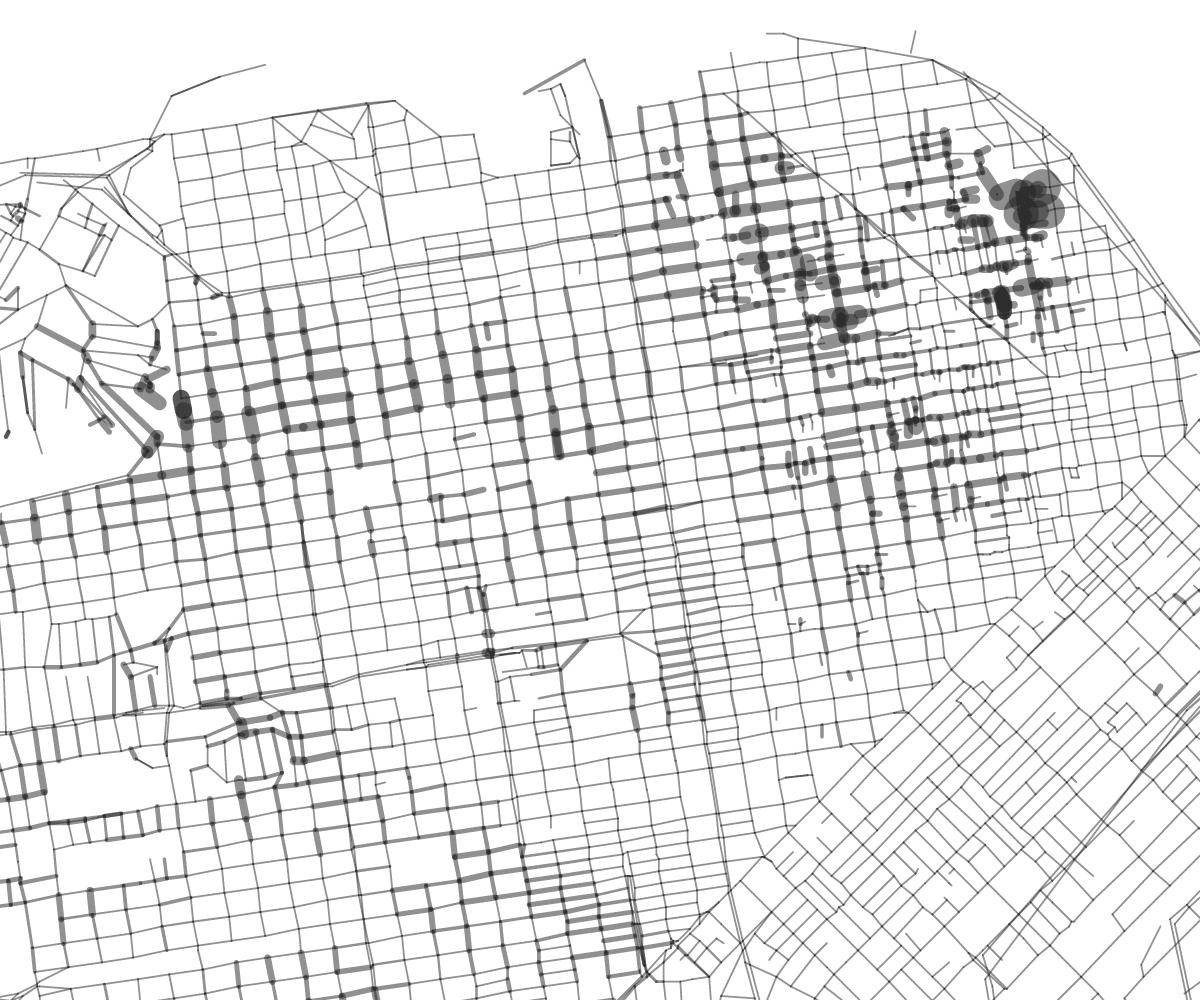
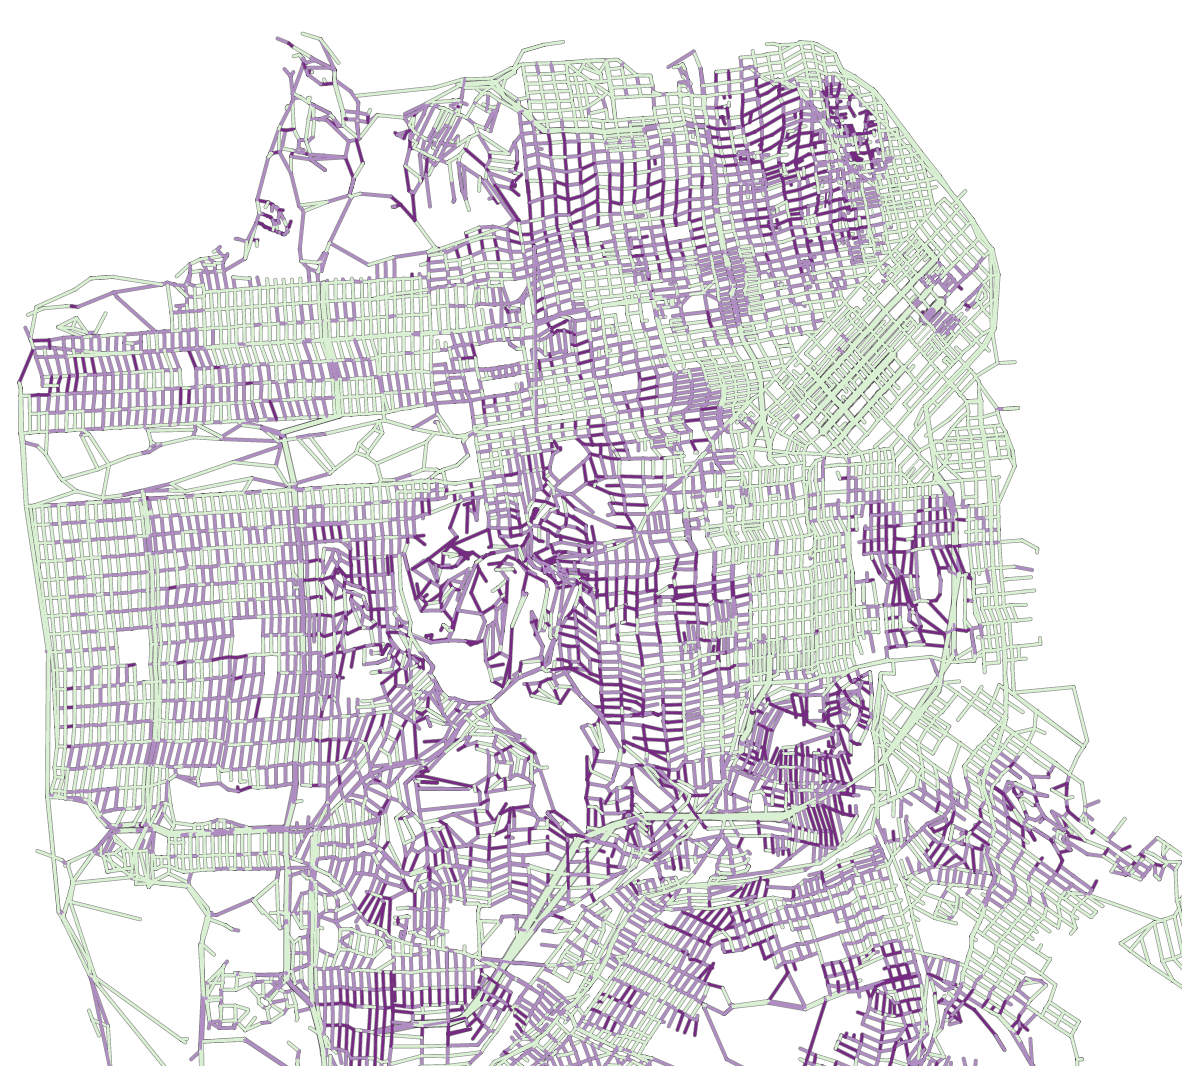
I could see instantly which streets were flat or not, yet wondered if there wasn’t a good simple way to compare between two streets which would be the steepest. Color is no good for that, but how about line width?

Using line width to express steepness

Using line width to express steepness

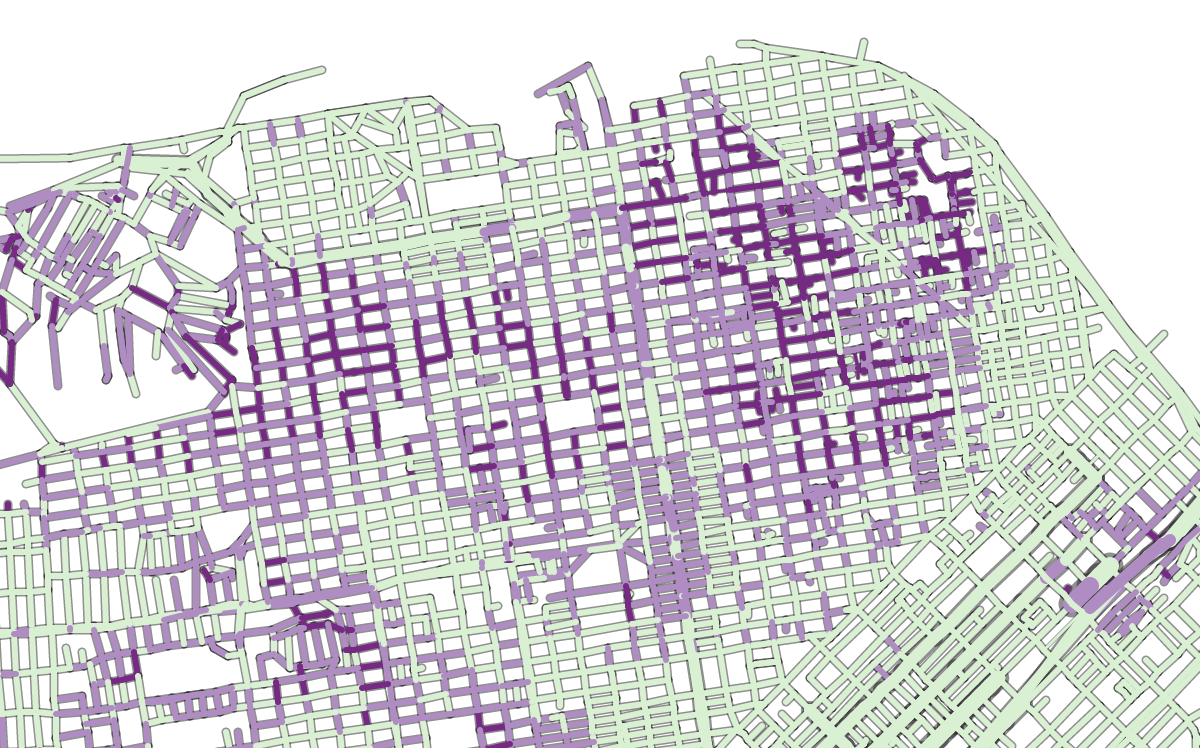
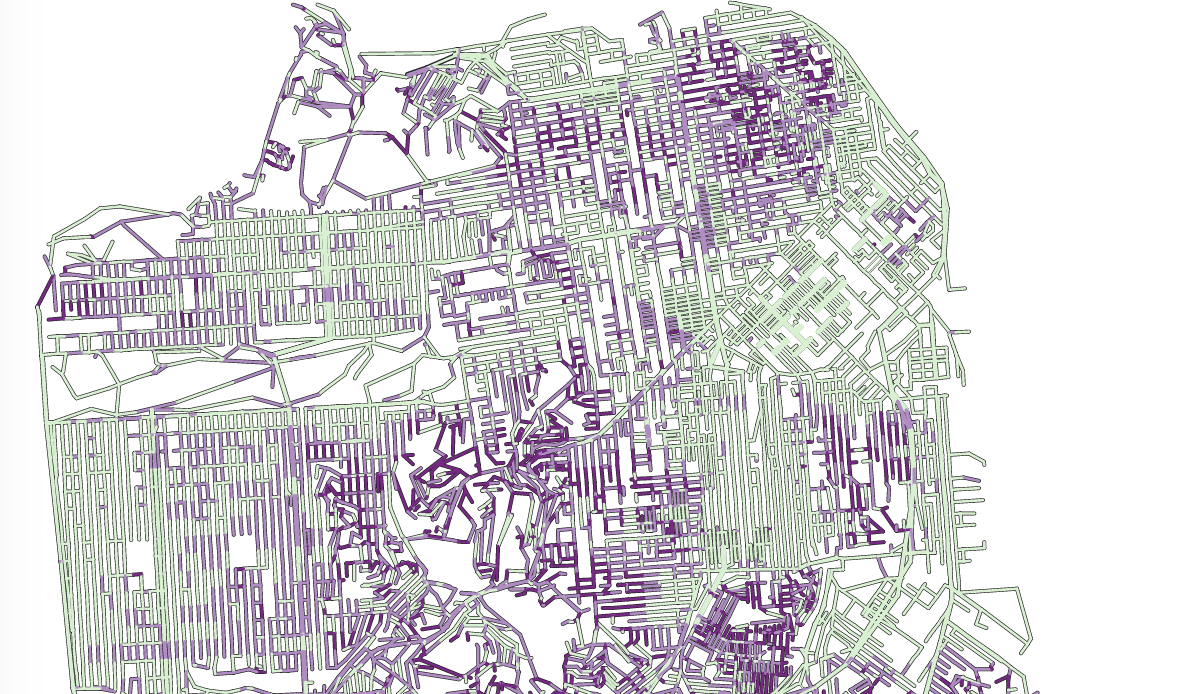
That was kind of an interesting aesthetics but I found it was difficult to find a precise cross street. When looking on a map of San Francisco, we instinctively look for larger streets like Market or Van Ness and if width was used by something else, it can be confusing. At that moment I didn’t have a good measure of street width, so I went back to my OSM extract and tried to scrap the number of lanes from my dataset.

using street widths

using street widths

You will notice that the streets now have an outline. I don’t draw the shape of each block, that would be too difficult given my dataset. Instead, for each street segment, I first draw a dark grey line, then on top of it, a slightly thinner colored line 🙂

Have the map do something

This being a data visualization I thought there could be interesting calculations that could be done with the map. My first intuition was to reuse the ideas of my interactive Paris metro map and make a deformed SF map based on the effort needed to go from one point of the map to everywhere, taking the slopes of the streets into account.

I basically refactored my code which I hadn’t visited in almost two years… and adapted shortest-path algorithms to my network of streets. It confirmed what I feared, that not all of my streets connect. Some streets in the map form tiny islands which are isolated from the rest of the network, and so cannot be reached from outside. I decided not to deal with it, debugging the dataset was really too complicated at this stage (and to be honest the filters I had used to extract the street data had already gone through many, many iterations).

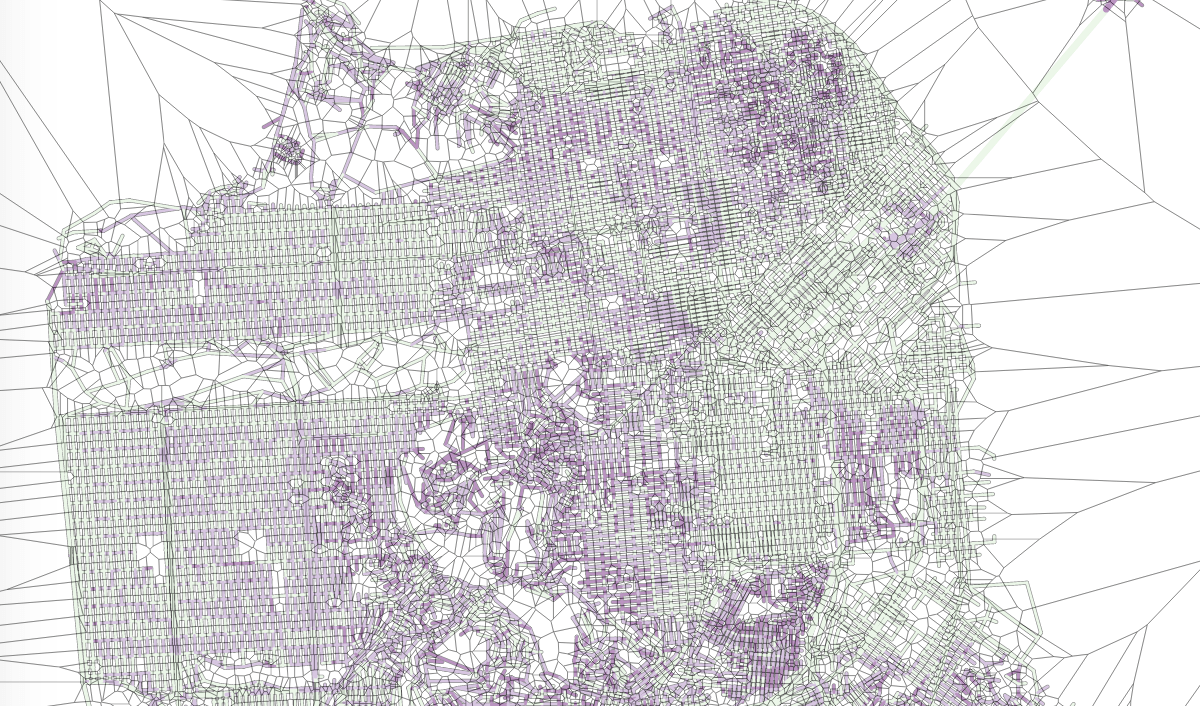
I also used voronoi tessellation to create a layer of polygons on top of my nodes to capture clicks. The user can choose where to base their map, not by clicking on a precise cross street, but in the area around it, like so:

Showing the voronoi layer on top of the map

Showing the voronoi layer on top of the map

However, the results proved to be underwhelming.

Deformed map by effort needed to walk from a given point

Deformed map by effort needed to walk from a given point

All right, so some points are closer, some points are further, but overall it’s not a super interesting map. It’s less legible, and it doesn’t help me figuring out my initial problem: from a given point, which streets should I take to not go up and down?

So I was back to the drawing board. Now with the Dijkstra algorithm which I use to compute the shortest distance from one point to the others in the network, I can also get which path is the shortest, i.e. which is the actual itinerary, edge by edge, that takes me from one point to the others using the shortest path.

Path-finding

So my next idea was to hide all the edges that would not be in a shortest path. Again there were about 16000 edges, and 10000 nodes; there is only 1 shortest-path edge per node, so that’s hiding about 1/3 of the streets. Let’s see how this looks:

All streets which are not in a shortest path are hidden.

All streets which are not in a shortest path are hidden.

That’s more interesting! At least, I know which streets I should not even consider from a given starting point.

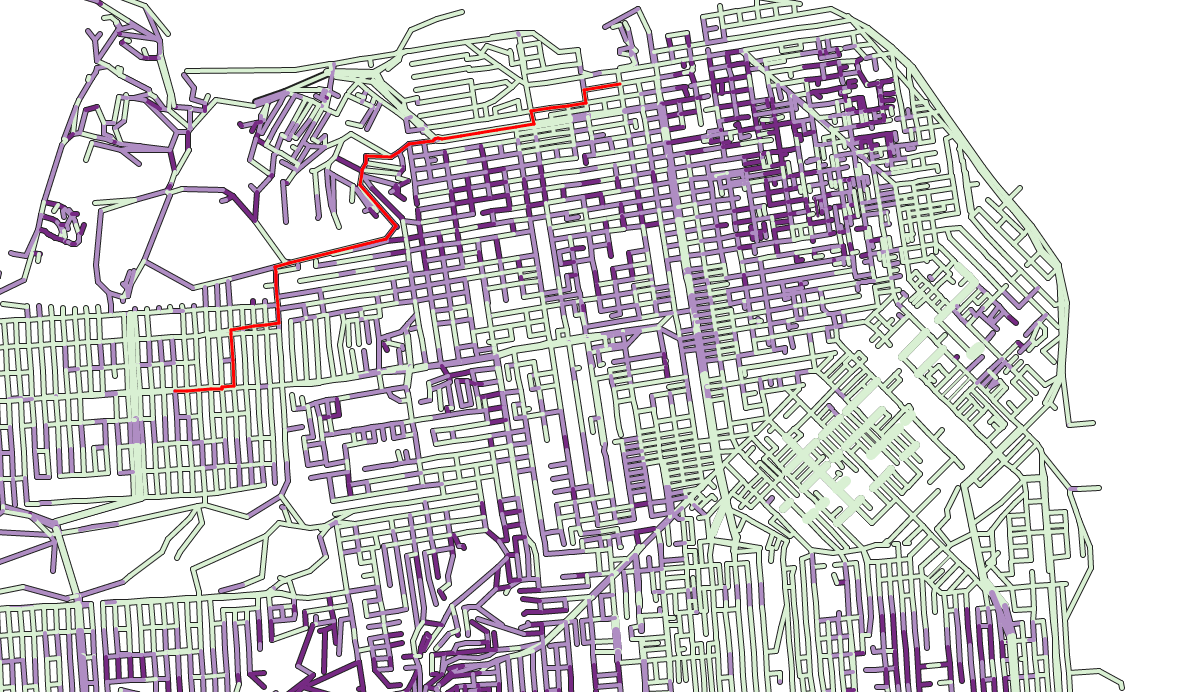
I could do better: once this is done and a starting point is selected, I can actually draw the shortest path to wherever the user moves his or her mouse:

Drawing the shortest path

Drawing the shortest path

Styling and wrapping it up

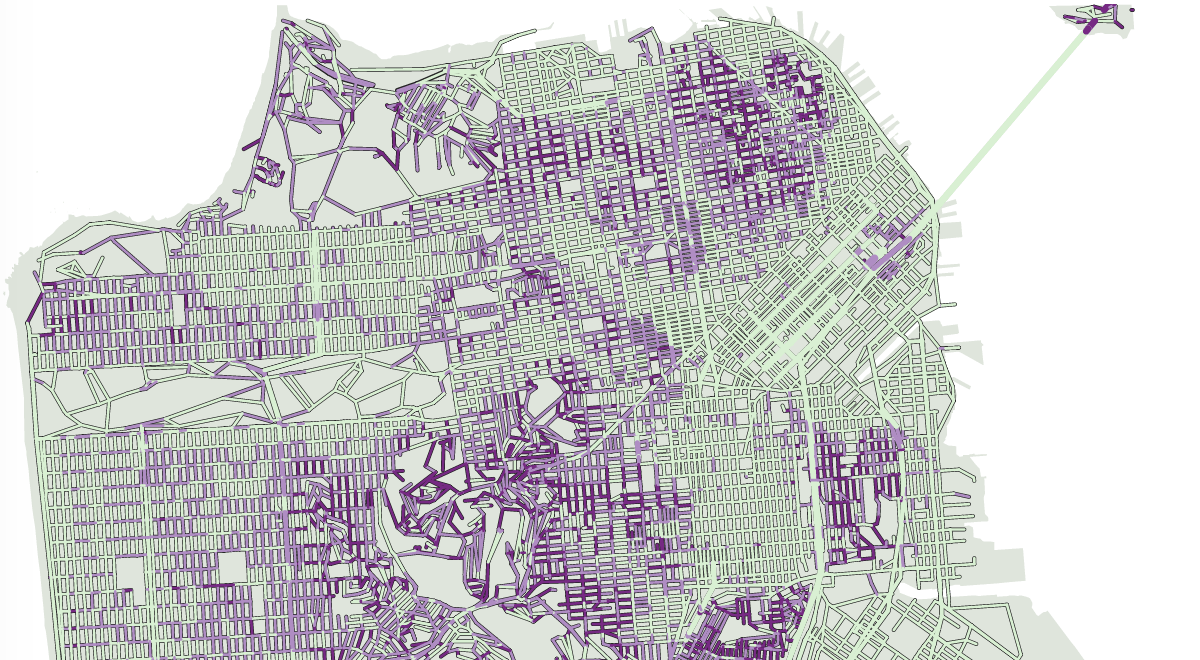
In parallel I had worked on a page template to put everything on and my map looked kind of abstract. I had considered adding street names but algorithmically it’s pretty complicated (it would have been much quicker to do it completely manually but eventually I decided against that). I needed the map to belong to one specific part of the page as opposed to be just hanging in free space. For this I thought I really needed the shape of the land.

So I went back to my OSM dataset and this time looked at the nodes which were on coastlines. Coastlines, though, are lines, not shapes, so some reworking was in order. In the original dataset there were some 200 different lines. Many of them were outside San Francisco proper, but still by removing those there were about 50 left. Many of them could be joined, and I had just to do a tiny bit of manual stitching to come up with one landmass shape for San Francisco.

Now with a landmass

Now with a landmass

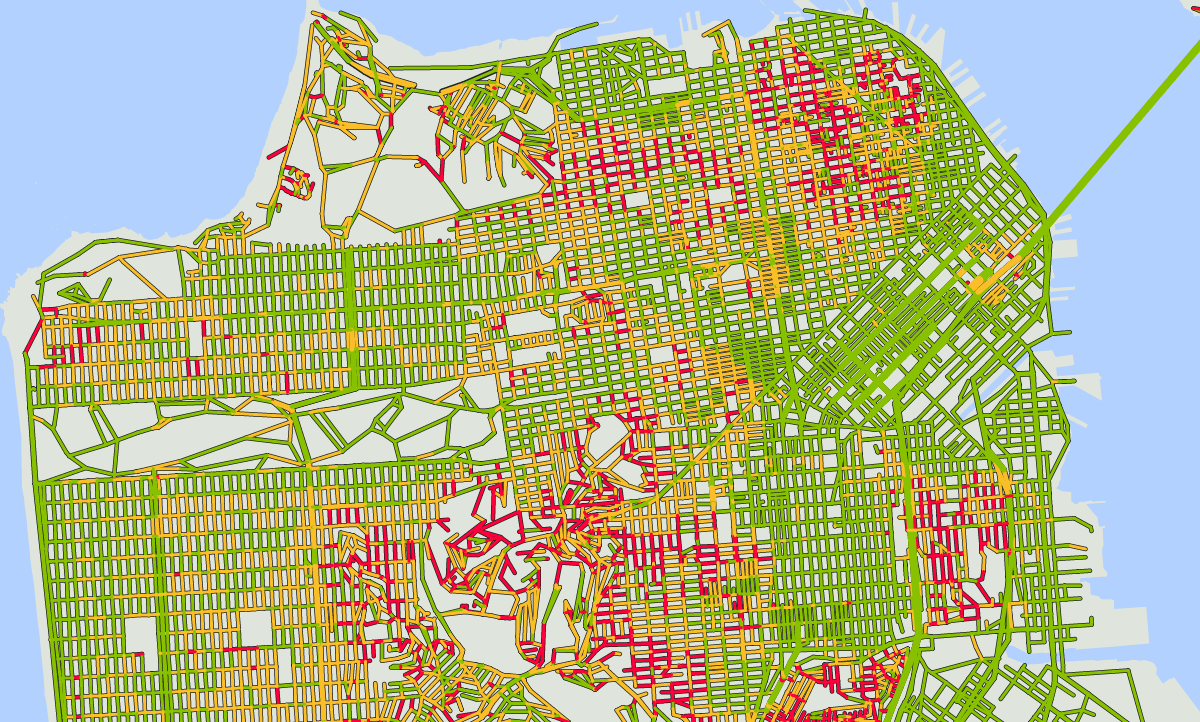
I tried various combinations for styling and finally fell back on using green, orange and red for the steepness – the very palette I avoided in the beginning. I used more balanced, slightly less saturated colors though.

One last thing I did on the data side was to get, for every node (which is every end of street or cross-street) the name of all the streets that go through it, so I could describe them – both the first node the user will click on and anyone he or she will mouseover on.

The end result!

The end result!


Getting beyond hello world with d3

About a year ago I proposed a very simple template to start working with d3. But is that the way I actually work? Of course not. Because, though you and I know that displaying hello world in d3 is not exactly trivial, this is not a highly marketable skill either. That said, I just can’t afford to start each of my projects from scratch.

So in this article I will present you the template I actually use. I won’t go in as much detail as last time because the exact instructions matter less than the general idea.

My template is a set of two files, an html file and a js file. Of course, extra files can be used as needed.

There’s not much to the html file – its role is really to call the javascript code. There is a little twist though. This is also where the interface elements (ie buttons and other controls) may be. Another thing is that I don’t load a css file through the html. The reason is that when I work with svg, I may export the svg proper to a file to have it reworked in Adobe Illustrator etc. and so having style inside the file makes things easier. So I would instead load a style sheet into the svg through javascript.

The javascript file is written with the following assumptions:

  • there could be other scripts called by the same page, so let’s try to avoid conflict as much as possible.
  • some variables need not to be accessed by other scripts.
  • the execution of my visualization is divided into several phases:
    • initialize: assigning initial values to variables, if needed forecasting interaction,
    • loading data: acquiring and processing external data,
    • drawing: this is where the visualization will be actually rendered or updated

    In addition to these three phases which always occur in my visualizations, there are several optional operations which I may or may not use which are included in the template.

    • reshaping data: operations like filtering or sorting the initial dataset after certain choices of the user. Following such an operation, the visualization has to be re-rendered.
    • self-playing animation: when this is required, then the visualization should be able to update itself at given intervals of time. If that is the case, then the html will include controls such as a start and stop button and a slider that can be used to move to an arbitrary time. Then, the javascript includes functions to start and stop the animation, and the drawing function is done so it can be called with a time argument, and not assuming that it will always just show the next step (because the slider can be used to jump ahead or back).
    • helper functions which can make me gain time but which don’t need to be accessed by other scripts.

To address the first concern, I wrap all my code in an anonymous function, like so:

(function() {
// ... my code
})();

within that function, any variable which is declared using the var keyword is not accessible to other scripts. Variables which are declared without the var keyword, however, can be accessed. So in order to minimize the footprint of my code, I create one single object, vis, so I can store the functions and values I will need to call as properties of that object.

(function() {
vis = {}
vis.init = function() {
// code for my init function ...
}
vis.height = 100;
var local = 50;
})();

So outside of that anonymous function, I can call vis.init(), I can access and change the value of vis.height, but I cannot access local.

One step further:

(function() {
vis = {}
vis.init = function(params) {
  // code for my init function ...
  vis.loaddata(params);
}
vis.loaddata = function(params) {
  // code for loading data ...
  vis.draw(params);
}
vis.draw = function(params) {
  // code for drawing stuff ...
}
})();

This gets a bit closer to how the code actually works. From the HTML, I would call vis.init and pass it parameters. vis.init will do its thing (assigning values to variables, creating the svg object, preparing interactions etc.) then call vis.loaddata, passing the same parameters. vis.loaddata will fill its purpose (namely, load the data and perhaps do a little data processing on the side) then call the drawing function.

Any of these functions can be called from the outside (from the HTML, ot from the console for debugging). The nice thing about it is that nothing really happens unless there’s an explicit instruction to start the visualization.

Let’s go a step deeper:

(function() {
vis = {}
var chart, svg, height, width;
vis.init = function(params) {
  if (!params) {params = {};}
  chart = d3.select(params.chart || "#chart");
  height = params.height || 500;
  width = params.width || 960;
  chart.selectAll("svg").data([{height: height, width: width}]).enter().append("svg");
  svg = chart.select("svg");
  svg
   .attr("height", function(d) {return d.height;})
   .attr("width", function(d) {return d.width;})
  vis.loaddata(params);
}
vis.loaddata = function(params) {
  if (!params) {params = {};}
  d3.csv((params.data || "data.csv") + (params.refresh ? ("#" + Math.random()) : ""), function(error, csv) {
    vis.csv = csv;
    vis.draw(params);
  })
}
vis.draw = function(params) {
  // code for drawing stuff ...
}
})();

Now we’re much closer to how it actually works. After we create our publicly accessible object vis, we create a bunch of local variables. Again, these can be used freely by the functions within our anonymous function, but not outside of it (notably in the console). I’m assuming that the code can be called without passing parameters, in which case within the functions I am testing if params actually exists, failing that I give it an empty object value. This is because down the road, if it is undefined and I try to access its properties, that would cause a reference error. If params has a value, even that of an empty object, if a property is not assigned, its value is “undefined”. So let’s take a look at the first 2 lines of vis.init:

if(!params) {params = {};}
chart = d3.select(params.chart || "#chart");

if params is not passed to vis.init, it gets an empty object value (that’s the first line). So, all of its properties have an undefined value. So the value of (params.chart || “#chart”) will be “#chart”. Likewise, if params is passed to vis.init, but without a chart property, params.chart will also be undefined, and (params.chart || “#chart”) will also be “#chart”. However, if params is passed to vis.init and a chart property is defined (i.e. vis.init({chart: “#mychart”}), then params.chart will be worth “#mychart” and (params.chart || “#chart”) will also be “#mychart”.
So that construct of assigning an empty object value to params then using || is like giving default values which can be overridden.

Within vis.init, we use local variables for things like height, width etc. so we can redefine them with parameters, and they can be easily accessed by anything within the anonymous function, but not outside of it.
I’ve also fleshed out the vis.loaddata function.
Likewise, we use the same construct as above: instead of hardcoding a data file name, we allow it to be overridden by a parameter, but if none is specified, then we can use a default name.
The part with params.refresh is a little trick.
When developing/debugging, if your data is stored in a file, you are going to load that file many times. Soon enough your browser will use the cached version and not reload it each time. That’s great for speed, but not so great if you edit your file as part as your debugging process: changes would be ignored! By adding a hash and a random string of character at the end of the file name, you are effectively telling your browser to get your file from a different url, although it is the same file. What this does is that it will force your browser to reload the file each time. Once you’re happy with the shape of your file, you can stop doing that (by omitting the refresh parameter) and the browser may use a cached version of your file.
In the vis.loaddata function, the most important part is that d3.csv method. As you may remember this is what loads your csv file (and btw if your data is not in csv form, d3 provides other methods to load external files – d3.json, d3.text etc.). How this method works is that the associated function (i.e the bit that goes: function(error, csv) {}) is executed [em]once the file is loaded[/em].
So since loading the file, even from cache, always take some time, what’s inside that function will be executed [em]after[/em] whatever could be written after the d3.csv method. This is why in the loaddata function, nothing is written after the d3.csv method, as there is no reliable way of knowing when that would be executed. The code continues inside the function. At the very end of that function, we call vis.draw, passing parameters along.
If I need to load several files, I would nest the d3.csv functions like this:

d3.csv((params.data || "data.csv"), function(error, csv) {
  // .. do things with this first file
  d3.csv((params.otherfile || "otherfile.csv"), function (error, csv) {
    // .. and then things with that other file. repeat if necessary..

    // the end of the innermost function is when all files are loaded, so this is when we pass control to vis.draw
    vis.draw(params);
  })
})

Another way to do this is using queue.js which I would recommend if the nesting becomes too crazy. For just 2 small files it’s a matter of personal preferences.

It’s difficult to write anything inside the code of vis.draw in a template, because this will have to be overwritten for every project. But here is the general idea though.
vis.draw can be called initially to, well, draw the visualization a first time when nothing exists but an empty svg element. But it can also be called further down the road, if the user presses a button that changes how it should be displayed, etc.
So, if the external context doesn’t change, running vis.draw once more should do nothing. As such, I avoid using constructs like “svg.append(“rect”) ” and instead use “svg.selectAll(“rect”).data(vis.data).enter().append(“rect”)” systematically.
The difference between the two is that using append without enter will add elements unconditionally. Using it after enter would only add new elements if there are new data items.
But what if I need to draw just one element? well, instead of writing “svg.append(“rect”)”, I would write something like “svg.selectAll(“rect.main”).data([{}]).enter().append(“rect”).classed(“main”, 1)”.
Let me explain what’s happening there.
What I want is the function to create one single rectangle if it doesn’t exist already. To differentiate that rectangle from any other possible rectangles I am going to give it a class: “main”. Why a class and not an id if it is unique to my visualization? Well, I may want to have several of these visualizations in my page and ids should really be unique. So I never use ids in selections, to the exception of specifying the div where the svg element will sit.
If there is already one rect element with the class “main”, svg.selectAll(“rect.main”).data([{}]).enter() will return an empty selection and so nothing will happen. No new rect element will be appended. This is great because we can run this as often as we want and what’s supposed not to change will not change.
However, if there is no such rect element, since there is one item in the array that I pass via data, svg.selectAll(“rect.main”).data([{}]).enter().append(“rect”) will create one single rect element. The classed(“main”, 1) at the end will give it the “main” class, so that running that statement again will not create new rectangles. Using [{}] as default, one-item array is a convention, but it’s better than using, say [0] or [“”] because when manipulating our newly-created element, we can add properties to the data element (i.e. d3.selectAll(“rect.main”).attr(“width”, function(d) {d.width = 100; return d.width;}) ) which you couldn’t do if the data elements were not objects. (try this for yourself).

That being said, the general outline of the vis.draw function is so:

  • remove all elements that need to be deleted,
  • create all elements that need to be added, including a bunch of one-off elements that will only be created once (ie legend, gridlines…)
  • select all remaining elements and update them (using transitions as needed).

One last thing: how to call vis.init() in the first place? Well, the call would have to happen in the HTML file.

<script>
var params = {data: "data.csv", width:1400,height:800};
var query = window.location.search.substring(1);

var vars = query.split("&");
vars.forEach(function(v) {
	var p = v.split("=");
	params[p[0]] = p[1]
})
vis.init(params);
</script>

What’s going on there?
First, I initiate the params variable with some values I want to pass in most cases.
Then, the next line is going to look at the url of the page, and more specifically at the search part, that is, whatever happens after the ?. (I use .substring(1) as to not include the “?”).
The idea is that when I would like to pass parameters via the browser, like so: …/vis.html?mode=1&height=500&data=”anotherfile.csv”
The two splits (first by &, then by =) allow to get the parameters passed by url, and add them to params, possibly overriding the existing ones.
Then we pass the resulting params variable to vis.init.

Wihtout further ado, here are the two files in their entirety.

<!DOCTYPE html>
<meta charset="utf-8">
<head>
	<title></title>
	<style>

	</style>
</head>
<body>
<script src="http://d3js.org/d3.v3.min.js">
</script>
<div id="chart"></div>
<script src="template.js"></script>
<script>
var params = {data: "data.csv", width:960,height:500};
var query = window.location.search.substring(1);

var vars = query.split("&");
vars.forEach(function(v) {
	p=v.split("=");
	params[p[0]]=p[1]
})
vis.init(params);
</script>
</body>
</html>
(function() {
	vis={};
	var width,height;
	var chart,svg;
	var defs, style;
	var slider, step, maxStep, running;
	var button;

	vis.init=function(params) {
		if (!params) {params = {}}
		chart = d3.select(params.chart||"#chart"); // placeholder div for svg
		width = params.width || 960;
		height = params.height || 500;
		chart.selectAll("svg")
			.data([{width:width,height:height}]).enter()
			.append("svg");
		svg = d3.select("svg").attr({
			width:function(d) {return d.width},
			height:function(d) {return d.height}
		}); 
		// vis.init can be re-ran to pass different height/width values 
		// to the svg. this doesn't create new svg elements. 

		style = svg.selectAll("style").data([{}]).enter() 
			.append("style")
			.attr("type","text/css"); 
		// this is where we can insert style that will affect the svg directly.

		defs = svg.selectAll("defs").data([{}]).enter()
			.append("defs"); 
		// this is used if it's necessary to define gradients, patterns etc.

		// the following will implement interaction around a slider and a 
		// button. repeat/remove as needed. 
		// note that this code won't cause errors if the corresponding elements 
		// do not exist in the HTML.  
		
		slider = d3.select(params.slider || ".slider");
		
		if (slider[0][0]) {
			maxStep = slider.property("max");
			step = slider.property("value");
			slider.on("change", function() {
				vis.stop(); 
				step = this.value; 
				vis.draw(params);})
			running = params.running || 0; // autorunning off or manually set on
		} else {
			running = -1; // never attempt auto-running
		}
		button = d3.select(params.button || ".button");
		if(button[0][0] && running> -1) {
			button.on("click", function() {
				if (running) {
					vis.stop();
				} else {
					vis.start();
				}
			})
		};
		vis.loaddata(params);
	}
		
	vis.loaddata = function(params) {
		if(!params) {params = {}}
		d3.text(params.style||"style.txt", function (error,txt) {
			// note that execution won't be stopped if a style file isn't found
			style.text(txt); // but if found, it can be embedded in the svg. 
			d3.csv(params.data || "data.csv", function(error,csv) {
				vis.data = csv;
				if(running > 0) {vis.start();} else {vis.draw(params);}
			})
		})
	}
	
	vis.play = function() {
		if(i === maxStep && !running){
			step = -1; 
			vis.stop();
		}
		if(i < maxStep) {
			step = step + 1; 
			running = 1;
			d3.select(".stop").html("Pause").on("click", vis.stop(params));
			slider.property("value",i);
		vis.draw(params);} else {vis.stop();}	
	}

	vis.start = function(params) {
		timer = setInterval(function() {vis.play(params)}, 50);
	}

	vis.stop = function (params) {
		clearInterval(timer);
		running = 0;
		d3.select(".stop").html("Play").on("click", vis.start(params));
	}

	vis.draw = function(params) {
		// make stuff here! 
	}
})();
 

Making the game of thrones visualization

So I made this interactive visualization about the 5 Game of Thrones books. How?

The project

The visualization is based on the events which happen to the main characters of the books. With over 2000 characters and close to 5000 pages over 343 chapters, it’s not possible to show everything, so I took about 300 characters and restricted to a small selection of events, such as characters killing each other. Also, I regrouped characters in a 2-level hierarchy so that it would be easier to find them and see what happens at a higher level.

Data

Data is the first word in data visualization, and in order to visualize one must collect data.
this has not been a small task. When I read the books, which was a while back (before a Dance with Dragons was published), I had already half a mind to make a visualization, so I jotted down some notes but I had no clear idea of how it would look like. But I started writing down when in the books characters did die. Eventually I realized that if I wanted to prioritize characters I had to find a way to discriminate between those who appeared infrequently and could be left out, and those who were recurring. So, I had to find a way to determine when did the various characters appeared and what happened to them.

To achieve that I had the five books in printed version, which is definitely not the best way to approach this. So I tried to find something to scrape. So I approached this on two fronts. On one hand, I got a raw text version of the books. But they were very hard to scrape. For instance, there are at least 11 different characters named Pate (just Pate), and 23 called Jon something. Besides, many have aliases, titles and other names so a query to find all instances of “Jon” won’t capture all mentions of, say, Jon Snow, but will also return appearances of the Jon Conningtons, Jon Arryns and the like. To make matter worse, my text file was scanned from the book and was of less than optimal quality, with many typos on names.

The other source were the two fan-maintained ressources on the series, Tower of the Hand and a Wiki of Ice and Fire, which both contain summaries of the chapters and information on the characters. Some chapters were described in meticulous detail with all the characters that appear specified, and a description of all that happens then. But others are more loosely narrated. That said, both sites propose an exhaustive list of characters of the books which were extremely useful.

So I first scraped a wiki of Ice and Fire to know which characters were mentioned in each chapter, then read the summaries to get a feel from the events happening, which I maintainted by hand.

With that first level of material, I decided to keep characters mentioned at least 5 times, or the named character who had been killed by another named character (as opposed to “a guard” being killed by “a soldier”). That left me with about 250 characters (out of slightly over 2000). Later, when the visualization became usable, playing with it I found some inconsistencies – how come this character is not dead yet in that book? That was because some characters were missing from my roster. So by checking in the original books, I increased the roster to about 300 (296 precisely). Also for most (and not all) characters, using the text file, I was able to get all the mentions of a given character in all the books.

Data analysis

I wanted to do something around the relationships among characters and I soon noticed that there are many cliques, that is groups of characters where every one of them trust every other one. This is the case of most families of organizations. When there is one character that defects, this is clearly signalled. You never get a situation where A trusts B but not C, B trusts C and not A and C trusts A and not B, or anything complex really.

But still, that’s many, many groups.

While in the books, families and groups are presented as independent entities, they almost always align on a larger, more powerful one. So it was interesting to regroup the smaller groups in larger alliances, especially if the focus was to represent kills

In the books most characters belong to or serve noble houses, and those who don’t belong to well-identified groups. There are very few characters who just mind their own business. There is a plethora of such Houses which can make things confusing (and again: 2000 characters). After several attempts I concluded it’s neither possible nor a good idea to represent this diversity visually. Instead, I tried to “group the groups” and to create higher-level aggregates.

Eventually (and I did that fairly late in the process, after few tries on the visualization) I created 5 groups. One for the Starks and the Lannisters, which are the families which receive the most attention during the book, as 70%  of the chapters are written from the point of view of a member of either family.Also, contrary to the Targaryen house whose point of view accounts for about 10% of the book, Starks and Lannisters have many allies and followers. So, as a consistent group they are larger and more interesting.

The other 3 groups are as follows: antagonists, that is aggressive characters (including monsters) who may attack any other; neutral characters, who tend to stay out of conflict, and opportunists, who look for more power.

Each of the 5 groups exhibits different patterns when it comes to killing: Starks (“the good guys”) don’t kill their own or neutral characters, but may have to fight characters from the other groups; conversely, some characters in the Lannister clan or among opportunists may carry out assassinations where anyone can be targeted. Neutral characters don’t fight except against antagonists, and the latter may fight characters from any group.

Drawing the visualization

I started thinking of that project a long time ago, and I’ve made experiments taking many forms. One of such form was a previous visualization on the places in Games of Thrones. That one visualization was the low-hanging fruit of the dataset I was building and refining. I knew I wanted to show events happening to the characters. Originally I thought of something linear, like a gantt chart, possibly grouping the characters by families which would be collapsable. But even in the broad sense that’s a lot of families, it wouldn’t make the visualization very legible.

What I had in mind then was to find a way to represent the status of the characters over time, who got killed, who got crippled, that sort of thing.

Eventually, I thought it was more interesting to represent the relationships of characters among themselves, so I started to take notice of all the interactions between characters, such as: who kills whom, who captures whom, who marries whom, etc. There were many which didn’t make it in the final visualization which is already complex enough as is.

I thought of the chord form early because it’s possible to use it to represent a lot of nodes and a lot of relationships among them even and even if it’s difficult to see one individual node expect the most important ones, and even more difficult to see one individual relationship, it’s possible to get a vague idea of mass. So I thought of representing characters as circles around a main circle coloring them by family or something. But doesn’t work, there are just too many different families. By so doing I was just plotting complexity.

Then, I realized that one very important aspect of the story, that is, one way in which a visualization could actually help understand what’s going on in the books, is that of trust. Within a group, all characters trust each other. Actually, this is much simpler than in real life: Westeros families are very close-knit; there are no murders among siblings or even though such things were commonplace in History! In network parlance, a group of entities which are all connected among each other is called a clique. And Game of Thrones is really a game of cliques. In all key moments of the book, one character of the clique will change sides. So all other characters of that clique continue to trust him, without realizing that he is setting them up, and a string of murders usually ensues.

So I decided to show action only at the clique level (families, organizations…). The problem I had was that once a character dies the representation of the clique won’t change much, whereas if I represented characters individually I could reflect that state of affairs.

So I thought of drawing one circle per clique around the main circle, and to represent characters individually within those circles using the packed circle method.

The method I chose was good (but not completely accurate) at preserving the relative importance of one clique compared to all the others, but just barely ok at preserving the relative importance of one given character.

I would take all the mentions of all the characters, tally that by clique, then take the square roots of that for each clique. Then, for each clique I compute the ratio of that square root to the sum of all the other square roots.

I multiply that by 2π and that’s an angle, that’s the “slice” of the main circle that will be occupied by the circle corresponding to that clique. Picture:

(btw click on the circle on the left to regenerate the data points)

So while those proportions don’t exactly match they are very very close. That doesn’t hold at the character level, because the sum of the areas of the character circles can occupy anywhere between 50% and 100% of the areas of the larger circle. But that’s not important. Accuracy is not important, as long as it is sufficient to say: this character appears often and this one doesn’t.

Two other technical points about the making of the viz.
All positions for all possible time periods had to be computed ahead of time.
In d3, it is natural to add, add, add stuff over time without worrying so much. More data? we’ll just add more datapoints.
Here I couldn’t really do that because I allowed the user to go back and forth in time. So a user could set the visualization in autoplay and go from time 0 to time 50, for instance, then pause and jump to time 200 and then back to time 25.
So it wasn’t possible to read the datafile in sequence and to draw some additional data points at each step. In the above exemple, all that happens between time 50 and time 200 has to be shown at once, and then all that happened between time 25 and time 200 has to be hidden at once.

so it’s just a matter of separating the code that calculates all the positions from the one that draws the viz, two operations which more often than not are intertwined.

Last, in the visualization I get to write group names in a circle around the main circle. How is this done?

Well, in svg, you can’t write “on a circle”. You can write on a path, which can be anything, a circular arc for instance. In this case it’s a bit more complicated because I wanted to make sure that the writing would not be upside down. So I actually used two arcs.


Selections in d3 – the long story

This past week, Scott Murray and I presented a tutorial at Strata on d3 (of all things!)
First things first, you probably want to get Scott’s book on the subject when it’s out. I should be translating it into French eventually.
You’re also welcome to the slides and examples of the tutorial which can be found on https://github.com/alignedleft/strata-d3-tutorial. That include my d3 cheat sheet.

We had done a d3 workshop a few months back at Visweek with Jeff Heer. This time around, we changed our approach: we covered less ground, went at a slower pace, but targeted what is in our opinion the most troublesome aspects of learning d3: selecting, creating and removing elements.

I have learned d3 from deciphering script examples and in the earliest ones one ubiquitous construct was this sequence : select / selectAll / data / enter / append.
It does the work, so like everyone else I’ve copied it and reused very often. It happens to be the most proper way of adding new elements in most cases, but the point is, while learning d3, I (and many people before and after me) have copy/pasted it without understanding it deeply. Though, copy pasting something you don’t understand thoroughly is the best way to get errors you don’t understand any better, and it would prevent you from accessing the rest of the potential of the library. Conversely, once this is cleared, you can be “thinking in d3” and easily do many things you might have thought impossible before.

We did the tutorial hands-on, live coding most of the time. To follow through, I invite you to create or open an empty page with d3 loaded (such as this one – the link opens a new tab) and then open the “console” or “web developer tools” which allow you to type javascript statements directly, without having to write and load scripts. Here are the shortcuts to the console:

  • Chrome: Ctrl-J (windows), ⌥ ⌘+j (Mac)
  • Firefox: Ctrl+Shift+k (windows), ⌥ ⌘+k (Mac)
  • Safari: Ctrl+Alt+c (windows), ⌥ ⌘+c (Mac)
  • IE9+: F12

To make the best of this tutorial, please type the examples. Some tutorials show you impressive stuff and show you step by step how to do it. That’s not one of them. I’ve sticked to very, very basic and mundane things. We’ll be only manipulating HTML elements such as paragraphs, which I assume you have seen earlier (plot twist: you are reading one at this very moment)
Some of the code snippets don’t work. That’s the idea! I think you can’t progress by merely copying code that works. It’s important that you try out code that looks reasonable but that doesn’t produce the expected result or that causes an error, but then understand why.

Adding simple stuff

Creating elements

Our empty page is, well, empty, so we are going to add stuff.
to create elements, we need the append method in d3, which takes as an argument the type of element that needs to be created, while the html method at the end allow us to specify a text.

so let’s go ahead and type:

d3.append("h1").html("My beautiful text")

and see what happens.

what do we get? and why is that?
In d3, every element which is created cannot appear out of thin air, and must be added to a container. If we don’t specify a container element, we just can’t create anything.
In HTML, most elements can be containers, that is, it’s usually possible to add elements to almost everything. Then again, our template is fairly empty, so we can select the tag and take it from there.

d3.select("body").append("h1").html("My beautiful text")

we’re in business! as long as there is a sensible place to put them, you can create as much stuff as you like. Since we’re on a roll, why won’t we throw in a few paragraphs (p element in HTML):

d3.select("body").append("p").html("Look at me, I'm a paragraph.")
d3.select("body").append("p").html("And I'm another paragraph!")
d3.select("body").append("p").html("Woohoo! number 3 baby")

and lo and behold, all our paragraphs appear in sequence. Simply beautiful.
But wait! paragraphs are containers, too. Why don’t we try to add a span element to one paragraph? For those of you with no HTML knowledge, span elements are like paragraphs, except there is no line break by default at the end.

So let’s try this:

d3.select("p").append("span").html("and I'm a span!")

Before typing it, take a minute to think where you expect it to go.
Then go ahead and type it.

Surprised?
you may have guessed that our new bit of text could go on a line of its own at the end of the document, or at the end of the last paragraph. But instead, it goes at the end of the first paragraph.
Why is that? well, our select method stops the first instance of whatever it tries to find. In our case, since we asked it to find paragraphs – p, it stopped at the first p element it found, and added the span at the end of it (append).

Beyond creating new things

adding new elements to a page programmatically is kind of useful, but if d3 stopped at that you probably wouldn’t be so interested in this tutorial to begin with. You can also modify and manipulate elements. We’ve done that to some extent with the html method. But we can also modify the style of the elements, their attributes and their properties. For the time being, don’t bother too much about the difference between these three things. Style refers to the appearance of elements, attributes, to their structure, and properties, to what can be changed in realtime, like values in a form. But again, let’s not worry about that for now and let’s just follow along. Look at this code snippet:

d3.select("p").style("color","red")

this will select the first paragraph and change its style, so that the text color is changed to red.
But wait! our first paragraph, isn’t that the one with a span at the end of it? What will happen to that bit of text? Well, type the statement to find out.
All the paragraph, including its children (that is, everything added to it, in our case the span) is turned to red.

d3.select("span").style("color","blue")

That singles out our span and writes it in blue. Can this be overturned?

d3.select("p").style("color","red")

That won’t change a thing. Our first paragraph is, in fact, already red. But its child, the span, has a style which overrides that of its parent. To have it behave like the rest, we can remove its style like so:

d3.select("span").style("color",null)

then

d3.select("p").style("color","green")

it will behave like its parent, the paragraph.
But let’s try something else:

d3.select("span").style("color","blue")

we write our span in blue,

d3.select("span").style("color","green")

and now back in green, like its parent.

d3.select("p").style("color","red")

What will happen?
well, the paragraph turns red, but the span doesn’t. It’s still following its specific instruction to be written in green.

That goes to illustrate that children behave like their parents, unless they are given specific instructions.

For HTML elements, we can play with styles, not so much with attributes or properties. One thing worth noting though is that an element can be given a class or an id.

Classes and ids can be used to style elements using a cascading style sheet (CSS). Knowing how CSS works is entirely facultative in learning d3, since d3 by itself can take care of all styling needs. Though, knowing basic CSS is not the most useless of endeavors, and some sensible CSS statements can save a lot of tedious manipulation in d3.
The other use of classes and ids is that they can be used to select elements.

Let’s reload our page so we start from scratch.

d3.select("body").append("p").html("First paragraph");
d3.select("body").append("p").html("Second paragraph").attr("class","p2");
d3.select("body").append("p").html("Third paragraph").attr("id","p3");

without the use of classes and ids, it’s still possible to select and manipulate the 2nd or 3rd instance of an element, but it’s a chore. You have to use pseudo-classes like d3.select(“p:nth-of-type(2)”) to select the 2nd instance of a paragraph, for instance.
Personally, I’d rather avoid this and prefer using simpler statements. With classes and IDs set, we can write instead:

d3.select(".p2").html("I'm classy");
d3.select("#p3").html("I've got ideas");

To select things of a given class, you must use a period before the name of the class. To select things of a certain id, you must use the hash sign.
Here, we are looking for the first element of the p2 class. This happens to be our 2nd paragraph. When you know you will have to manipulate elements which are not easily accessible, you may as well give them classes which will make this easier down the road.

In theory, there should only be one element of a given ID in one page, so I recommend not using them dynamically unless you can be 100% sure that there will not be duplicates. And, in case you were wandering, one element can have several (even many) classes.

Two birds, one stone

Introducing selectAll

So far, we’ve changed properties of one element at a time. The exception was when we changed the colors of both a paragraph and a span, but even then, we were still technically only changing the characteristics of one paragraph, which its child, the span, just happened to inherit.

For a complex document, that can be super tedious, especially since we’ve seen that it’s not easy to retrieve an element which is not the first of its kind.

so let’s go ahead and type:

d3.selectAll("p").style("font-weight","bold");

(for a little variety. I mean, changing text color is so 1994.)
What was that? Everything turned to bold!

Indeed: while the select method returns the first element that matches the clause, selectAll matches them all.
Let’s do more.
We’re going to add a span to our first paragraph.

d3.select("p").append("span")
.html("I'm a rebel child.")
.style("background-color","firebrick")

we’re adding a gratuitous styling command.
Now, let’s change the background color of all the paragraphs.

d3.selectAll("p").style("background-color","aliceblue")

As could be expected, the span doesn’t change its background color, and so it appears differently from its parent (which could be a desired effect – this gives us flexibility).
but what if we wanted to change the background color of everything? can we do better?

d3.selectAll("*").style("background-color","whitesmoke")

(quite fitting in these times of papal conclave)

Well – everything gets a background color of “white smoke” (which is a fine background color btw.). Including the “body” element – that is, everything on the page!
selectAll(“*”) matches everything. With it, you can grab all the children, their children etc. (“descendants”. I know…) of a selection, or, if used directly like so: d3.selectAll(“*”), everything on the page.
So we’ve seen we can select moaar. But can we be finer? Can we select the paragraphs and the spans only, without touching the rest?

we sure can!

d3.selectAll("p, span").style("background-color","lawngreen")

The outcome of that one statement probably won’t make it to our web design portfolio, but it does the trick: you can select as much as you like, or as little as you like.

Nested selections

To illustrate the next situation, let’s add a span to our document.

d3.select("body").append("span").html("select me if you can")

Well, just like there is a way to select directly the 2nd paragraph using pseudo classes, there’s also a (complicated) way to select directly that last span (namely: selectAll(“span:not(p)”) )
there’s also a simpler way which is what we’re interested in.
let’s suppose we want to turn it to bold:
we can just do

d3.selectAll("span").style("font-weight","bold");

then change the first one:

d3.select("p").select("span").style("font-weight",null);

Admittedly, the complicated way is more compact. But conceptually, the “simple” way is easier to follow: we can do a selection, and within that selection perform a newer selection, and so on and so forth. That way, we can get away with just using super simple selectors, as opposed to master the intricacies of CSS3 syntax. Do it for the people who will read your source code 🙂

At this point:

  • You know how to dynamically create content. Pretty cool!
  • More! you can dynamically change every property of every element of the page. woot!
  • Bonus! you’re equipped with tactics to easily reach any element you want to change.

You should also have a good grasp of d3.select, d3.selectAll and the difference between the two.
what more could you possibly want? Well, since this is about data visualization, how about a way to tie our elements to data? This is what d3 is really about.

Putting the data in data visualization

Introducing data: passing values to many elements at once

So far, we’ve entered “hard coded” values for all of our variables. That’s fine, but we can’t really set our elements one by one. I mean, we could, but it’s no way to “industrialize” the way elements are created.
Fortunately, d3 provides. Its more interesting characteristic is the ability to “bind” elements with data.

If you’ve followed the instructions step by step, you should have 3 paragraphs in the page. Plus a span afterwards, but whatever.
Let’s introduce the data method. This will match an array of values to a selection of elements in the page. Let’s go:

var fs=["10px","20px","30px"];
d3.selectAll("p").data(fs).style("font-size",function(d) {return d;})

wow wow wow what just happened?
First, we create an array of values which we intelligently call fs (for font size).
Then, right after the selectAll(“p”) which gathers a selection of elements (3 “p” elements to be exact), we specify a dataset using the data method.
It just happens that our dataset has just the same number of items as our selection of elements!

finally, we use style, like we used to, with a twist: instead of providing one fixed value, which would affect our 3 p elements in the same way, we specify a function.
This function will parse the dataset, and for each element, it will return the result of an operation in the corresponding data point: the result of the function on the first item for the first p element, the result on the 2nd item for our 2nd paragraph, and lastly the result on the last item for our last paragraph.
We write the function with an argument: d. What is d? it’s nothing but a convention. We can call it anything. d is standard fare in d3 code because that’s the writing style of Mike Bostock, the author of the framework and of many of its examples.
This function is nothing special, it returns the element itself, so we are passing “10px” for the font-size of our first paragraph, and so on and so forth (20px, 30px).
As an aside, we can use the String function, which converts any element into a string, instead of writing function(d) {return d;}. So:

d3.selectAll("p").data(fs).style("font-size",String)

would also work and is shorter to write.

Let’s recap what just happened here, because this is important.
We want to apply a dynamic transformation to a bunch of existing elements, as opposed to finding a way to select each individual element, and passing it a hard-coded value.
What’s more, we want to apply a transformation of the same nature, but of a different magnitude, on each of these items.

How to proceed?
well, first we create an array of values. That’s our fs boy over there.

var fs=["10px","20px","30px"];

Then, we will first select all of the elements we want to modify, then we’ll tie our dataset to that selection. This is what selectAll, then data does.

var selection=d3.selectAll("p").data(fs);

By the way, I’ve stored the result of the selectAll then data in a variable. In the original example, I just “chained” the methods, that is, I followed each method by a period and another one. The two syntaxes are equivalent. Chaining works, because each of these methods returns a value which is itself a selection on which further operations can be done. This syntax works well through most of d3 with some exceptions which will be duly noted.

Then, we are going to change the style of the selection, using a function on our data.

selection.style("font-size",function(d) {return d;})

(or

selection.style("font-size",String)

That function will run on each value of our dataset, and return one result per value, which will be passed to all elements in sequence.

At this stage you may have two questions:

  • Can we use more sophisticated functions, because this one is kind of meh?
  • What happens if there is not the same number of items in the dataset and of elements?

The second question is actually more complicated than the first, but we’ll answer it in painstaking detail.
So let’s take care of the question on functions first.
Yes, obviously, we can use the function not just to return the element, but to do any kind of calculation that a language such as javascript is capable of, which is nearly everything.
To illustrate that, here are some variations of our initial code which will return the same result, but with a different form.

var fs=[10,20,30]; // no more px
d3.selectAll("p").data(fs).style("font-size",function(d) {return d+"px";})

Here, instead of returning just the element, we append “px” at its end. Sadly, style(“font-size”,10) doesn’t work, but style(“font-size”,10+”px”) – which is the same as style(“font-size”,”10px”) is valid.

Here is yet another way.

d3.selectAll("p").style("font-size",function(d,i) {return 10*(i+1)+"px";})

function(d,i) ? what is this devilry?
Here, i (or anything we want to call it, as long as it’s the 2nd argument of this function) represents the order of the element in the selection, so the first gets a 0, the second a 1, etc. (well, in our example it goes to 3 elements, so the last one gets a 2).
This may be a bit abstract to say here, but even if we haven’t passed data, this would still work – i represent the order of the element, not the data item. so, if no data had been passed, within this function call, d would be undefined, but i would still be equal to 0,1,2, …

The answer to the second question is the last great mystery of d3. Once you get this, you’re golden.

Creating or removing the right number of elements depending on data

Before we get further, let’s quickly introduce append’s reckless cousin, remove(). Writing remove at the end of a selection deletes all the corresponding elements from the document object model.
so,

d3.selectAll("p").remove()

would remove our 3 paragraphs. Let’s do it and get rid of our paragraphs.
Actually, let’s do

d3.select("body").selectAll("*").remove()

and remove everything below the body.

Now, earlier, we were alluding to what could happen if we didn’t have the same number of elements as of items in our dataset.

That means that we should be able to do the following:

  • If there are fewer elements than items in a dataset, create the missing elements
  • If there are fewer elements than items in a dataset, disregard the extra data items
  • If there are more elements than items in a dataset, remove the extra elements
  • If there are more elements than items in a dataset, don’t change the extra elements/li>
  • As data are updated, keep some elements, remove some, add some

Why would we want to do all of this?
The first case is the most common. When we start a data visualization script, chances are that there are no elements yet but there is data, so you’ll want to add elements based on the data.
Then, if you have interaction or animation, your dataset may be updated, and depending on what you intend to do you may just want to update the existing elements, create new ones, remove old ones, etc. That’s when you may want to do 2, 3 or 4.
The last (5th case) is more complicated, but don’t worry, we’ve got you covered.

Right now, we should have 0 p elements on our page (and if for some reason this is not the case, feel free to reload it).

let’s create a variable like so:

var text=["first paragraph","second paragraph","third paragraph"];

somewhat uninspired, I know, but let’s keep typing to a minimum, if you want to go all lyrical please go ahead.

We are smack in case 1: we’d like to create 3 paragraphs, we have 3 items in our dataset, but 0 elements yet.
Here’s what we’ll type:

d3.select("body").selectAll("p").data(text).enter().append("p").html(String)

A-ha! we meet again, select selectAll data enter append.
After all we’ve done, select selectAll should make some sense, even though, at this stage, this selection returns 0 p elements. There are none yet.
Then we pass data as we’ve done before. Note that there are 3 items in our dataset.

Then, we use the enter() statement. What it does is that it prepares one new element for every unmatched data item. We’ll expand a bit later on the true meaning of unmatched, but for the time being, let’s focus on the difference. We have 0 elements, but 3 data items. 3 – 0 = 3, so the enter() selection will prepare 3 new elements.
What does prepare means? the elements are not created yet at this stage, but they will with the next command. Right after enter(), think of what’s created as placeholders for future element (Scott’s vocabulary), or buds that will eventually blossom into full-fledge elements (mine).
After enter(), we specify an append(“p”) command. Previously, when we had used the append method, we created one element at a time. But in this case, we are going to create as many as there are placeholders returned by enter(). So, in our case, 3.
You may legitimately wonder why we needed a select statement to begin with – after all, enter() works on the difference between selectAll and data. But when we are going to append elements, we will need to create them somewhere, to build them upon a container. This is what the first select does. Omit it, and you’ll have an error, because the system will be asked to create something without knowing where.
The final method, html, will populate our paragraphs with text. The String function, which we have already seen, simply returns the content of each item in our dataset.

We’re using select > selectAll > data > enter > append, but hopefully you will see why (and if you don’t, hang on to the end of the article, and feel free to ask questions).

But let’s recap once more. Actually, let’s see the many ways to get this wrong (or, surprisingly, right)

d3.selectAll("p").data(text).enter().append("p").html(String)

We’ve alluded to that: without a container to put them in, p elements can’t be created. This will result in a DOM error.

d3.select("body").selectAll("p").data(text).append("p").html(String)

No enter statement. After the selectAll, the selection has 0 items. This doesn’t change after the data method. As such, append creates 0 new elements, and nothing changes in the document. (but no error though)

d3.select("body").data(text).selectAll("p").enter().append("p").html(String)

In many cases in d3, it’s ok to switch the order of chained methods, but that’s not true here. selectAll must come before data. We bind data to elements. The other way round would have made sense, but that’s the way it is. First selectAll, then data. Here, we get an error, because enter() can’t be fired directly from selectAll.

d3.select("body").selectAll("wootwoot")
.data(text).enter().append("p").html(String)

This actually works. Why?
There are actually 0 elements of type “wootwoot” in our document, which may or may not surprise you. There are still 3 items in the dataset, so enter() returns space for 3 new elements. the next append subsequently creates 3 p elements, which are populated by the html method.
It usually makes more sense to use the same selector in the selectAll and the append methods, but that’s not always the case. Sometimes, you will be selecting elements of a specific class, but in an append method, you have to specify the name of an element, not any selector. So you’d go

d3.select("body").selectAll(".myClass")
.data(text).enter().append("p").html(String).attr("class","myClass")

Now that we’ve seen a few variations on the subject, here is a really cool use of enter. Check this out:

d3.select("body").selectAll("h1").data([{}]).enter().insert("h1").html("My title")

ok there are 3 things here worth mentioning. 2 are just for show, though it doesn’t hurt to know them, but the 3rd one is really neat and useful.
In data, we’ve passed: [{}]. This is an array of one object which is empty. There are two interesting things with that construct, one is that there’s only one element, the other one is that it’s an object. When you pass objects, the functions you run on them (like in the attr or style methods) can be used to add properties to them or change them. If that doesn’t make sense yet, just accept for now that it gives you more flexibility than using, say, [0].
We’ve used insert instead of append. What this means is that we’re adding things before the first child of our container, not at the end (ie after the last child). In other words, our h1 (a title) will go at the top of the body element – fitting.

But what’s really interesting is what would happen if you were to run that statement again – nothing. try it. See?
Why is that? Well, on your first go, at a point where there are no h1 elements yet, it works the standard way – you do a selectAll that returns nothing, you bind a dataset with more elements, then enter prepares space for the unmatched elements – 1 in our case – and then append creates that element. You may notice that the html part doesn’t use the data.
When you run it again, the selectAll finds one h1 element, there’s still one item in the dataset, so enter won’t find any unmatched element, so the subsequent append is ignored.

So, you can run this kind of thing in a loop safely, it will only do what it’s supposed to do on the first go, it will be ignored afterwards. Don’t be afraid to use this construct for all the unique parts of your visualization, so you won’t have to worry about creating them multiple times.

Other cases of mismatch between data items and elements

All right, so now we have 3 p elements and 3 items in our dataset.
What happens if we do this:

text2=["hello world"]
d3.selectAll("p").data(text2).html(String)

?

There is now one item in the data set, versus 3 p elements. Try to make a guess before you type this in. At the tutorial, the audience made a few reasonable guesses, namely: the last 2 paragraphs will be removed, only “hello world” will remain. Or: all paragraphs will be changed to “hello world”.
Either could happen if d3 was trying to be smart and guess your intent. Fortunately, d3 is no excel here and behaves consistently even if that means extra work for you. When you do that (and please try this now) what happens is that the first paragraph of text is changed and the other two are untouched.

We are in the case, change the matched elements, ignore the others.

By the way, by now you should be able to guess what would have happened if there had been an enter() right after the data. Do I hear… nothing? almost! There would be no unmatched data element, so enter() would not return anything. Besides, enter() would require an append afterwards to make anything. This is why you’ll get an error: html can’t work directly after enter(). you would need an append.

Now what if we want to remove the extra 2 elements? This is where the exit() method comes into play.
exit() is pretty much to enter() what remove() is to append(). Kind of.

let’s see how this work by example.

let’s recreate our 3 p paragraphs just in case:

d3.selectAll("p").remove();
d3.select("body").selectAll("p").data(text).enter().append("p").html(String);

Now we pass the new dataset:

d3.selectAll("p").data(text2).html(String)

– remember that only the first paragraph has changed, the other two are untouched.
Now, while all the items in the dataset are matched with elements, there are elements which are not matched with an item in the dataset: the last two. This is where exit() comes into play. exit() will select those two paragraphs, so they can be manipulated. Typically, what happens then is a remove(), but you could think of other options.

d3.selectAll("p").data(text2).exit().style("color","red");

That will flag them instead of removing them.
But typically, you do:

d3.selectAll("p").data(text2).exit().remove();

.

note that even though you have already matched a one item dataset to that selection, to use exit(), you will need to use data before. selectAll(“p”).exit() won’t work. You’ll have to re-specify the data match.

So that takes care of the case when you want to remove extraneous data items.
This leaves us with only one simple case: where you have more items in your dataset than you have elements and you don’t want to create elements for the extra data items.
That’s the simplest syntax, really.

Here, for instance, we have only one paragraph left, but there are 3 items in the text variable.
so let’s do:

d3.selectAll("p").data(text).html(String)

(no enter, no exit, no append).
The paragraph text will now come from the new dataset (from its first item to be precise), no extra paragraphs will be created, none will be deleted.

Data joins

the last case (pass a new dataset, create new elements as needed, make some elements stay and make some elements go) requires more complexity and actually I won’t cover it in detail here, instead I will explain the principle and refer you to this tutorial on object constancy by Mike Bostock.
In the general case, when you try to match your dataset to your elements, you count them and deal with the difference. So you have 5 data items and 3 elements: you can make 2 extra elements appear by using enter. With the concept of data joins, you can assign precisely each data item to one given element, so the first data item doesn’t have to be that of the first element, etc. Well, the first time it will be, and each element will receive a key, a unique identifier from the dataset. If the dataset is subsequently updated, the element will only be matched if there is an item in the dataset with the same key. Else, it will be found by an exit() method.

And that’s the general gist of it.
At Strata, we went further – we discussed interaction and transition, but that is downward trivial once you have understood – and by that, really understood, with all the implications and nuances – the selections.