Beyond rendering

This is the 5th post in my Visualization with React series. Previous post: React components

The lifecycle functions

I’m not going to go into great details on this, but a talk on React without mentioning the lifecycle functions would not be complete.
React components come with several functions which are fired when certain events occur, such as when the component is first created (‘mounts’), when it’s updated or when it’s removed (‘unmounts’).
Pure functional components, which we’ve been mostly using, don’t have lifecycle functions.
But components with a state can have them.

Some examples of usage of those lifecycle functions include:

  • Before the component is rendered, you can load data. that’s a job for ‘componentWillMount’.
  • After a component is rendered, you can animate it, or add an event listener. Use ‘componentDidMount’.
  • Prevent a component from rendering under certain circumstances, even if it receives new properties or its state changes. Use ‘shouldComponentUpdate’.
  • After a component receives new props or new state, you can trigger another function before the component updates (‘componentWillUpdate’) or right after (‘componentDidUpdate’).
  • When a component is going to be removed, you can do some cleanups, like deleting event listeners. Use ‘componentWillUnmount’.

Oftentimes, you can simply get by by using the default behavior of React components, which re-render only when they receive different properties or when their state changes. But it can be really convenient to have that extra degree of control.

Here is an example of using these lifecycle functions in context.

See the Pen lifecycle functions example by Jerome Cukier (@jckr) on CodePen.

What is going on there?
We’re adapting our earlier scatterplot example, only this time, we are not using pure functional components (which don’t have those lifecycle functions), but creating classes.
We’re going to have three classes: Chart, at the highest level; Scatterplot, a child of Chart; and Points.
Chart passes data to Scatterplot. What it passes depends on whether the button is clicked. That button changes the state of Chart (which causes a rerendering of the Scatterplot and the Point elements).
Chart also has a private variable that holds a message we can display on top. We can still use callback functions to change this variable, just like we change the state, but the difference between changing the state and changing a private variable is that changing a private variable doesn’t cause the children to re-render.
When we first create the scatterplot element, the componentDidMount function is called, and the message is changed to reflect that.
Then, each time we click the button, a different data property is passed to the Scatterplot element. Also, the componentDidUpdate method is triggered, which changes the message.
(changing the state of the parent from a componentDidUpdate method can cause an endless re-rendering loop, this is why I used private variables instead of the state, and there are ways to address this but for the sake of brevity this is the easiest way to deal with that problem).
Now, when a full dataset is passed to the Scatterplot element, many Point elements will be created. I’ve also added a lifecycle method to these Points: when they are first created, they receive a small animation. To that end, I have also used the componentDidMount method, but this time at the Point level.
Exit animations are also possible, but – full disclosure – they are less easy to implement in React than entry animations, or than in D3. So again in the interest of concision I’ll skip these for now.

React and D3

We just saw that with React, we can create a DOM element, then immediately after, call a function to do whatever we want, such as manipulating that element. That function would have access to all the properties and state of that React element.
So what prevents us from combining React and D3? Nothing!
We can create components that are, essentially, an SVG element, then use componentDidMount to perform D3 magic on that element.
Here’s an example:

See the Pen mixing react and d3 by Jerome Cukier (@jckr) on CodePen.

In that example, I have used a bona fide bl.ocks (https://bl.ocks.org/mbostock/7881887) and wrapped it inside a React component. So I can create one, or in the case of that example, several such elements by just passing properties. Those components can perfectly function as black boxes: we give them properties, they give us visualizations that correspond to these parameters. And it doesn’t have to be D3 – once a React element has been created, we can use componentDidMount to do all kinds of operations on it.

In the last 2 articles I will present actual data visualization web apps made with React.
In the next post, we’ll see how to set up a simple web app and we’ll create our first example app.
 

Coding with React

This article is part of my series Visualization with React. Previous article: An ES6 primer

Setting things up in Codepen

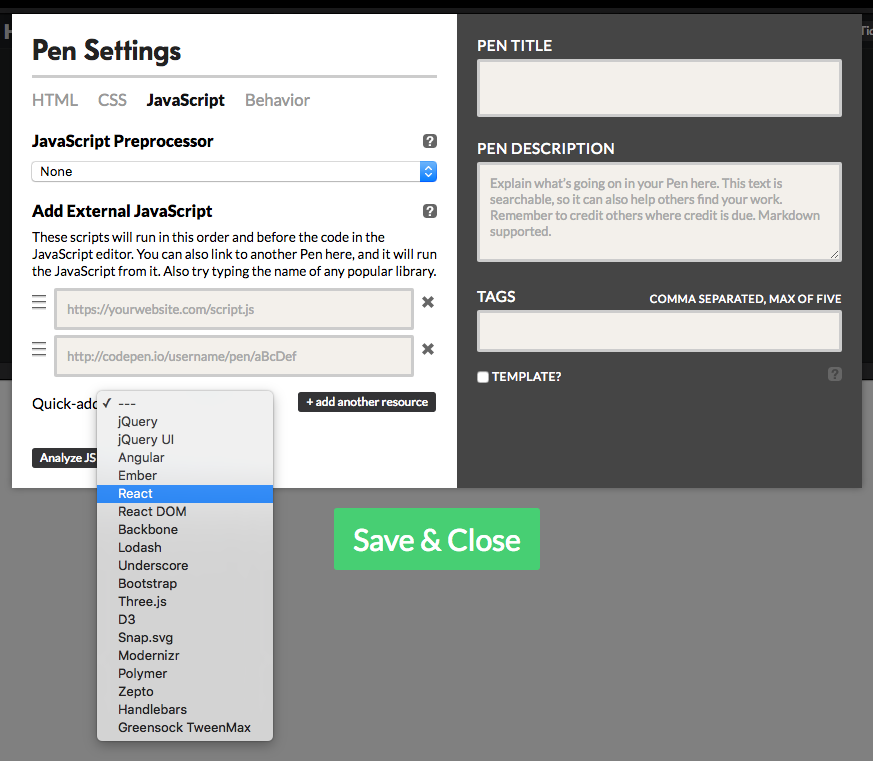
In the last two articles of the series, I’ll cover how to get a real React coding environment going, but to start dabbling, playgrounds like jsFiddle or codepen are great. I’m partial to codepen. When you create a new pen, you still have a couple of options to set up before you can start creating React code:

In the Settings / Javascript / quick-add section (the drop-down at the bottom left) please choose React, then React DOM.

All of the code examples of articles 1, 3, 4, and 5 can be found in this codepen collection.

Creating elements

See the Pen React simple scatterplot by Jerome Cukier (@jckr) on CodePen.

In this first React example, we’re going to create a couple of very simple elements and render them. Let’s start by the end: ReactDOM.render(myDiv, document.querySelector('#root')); We use ReactDOM.render to, well, render something we have created (myDiv) somewhere in our document (on top of what corresponds to the ‘#root’ selection. We conveniently have a div with the id “root” in the HTML part of the pen). That’s it! we’ve output something using React. While the syntax can appear a bit daunting, it really does one simple thing: take what you’ve made and put it where it should be. But what’s that myDiv? To find out, let’s look at the first 2 lines of our code. const mySpan = React.createElement('span', {style: {fontFamily: 'sans-serif'}}, 'hello React world'); const myDiv = React.createElement('div', {className: 'my-div'}, mySpan); Oh, so before there was a myDiv, there was a mySpan. MySpan is a React element, the building brick of the React eco system. To create it, we use React.createElement which is the workhorse of React. React.createElement takes three arguments: the type of React element we are creating, its properties, and its content. The type of element can be any HTML or SVG element, and we’ll see later that we can also make our own. The second argument is the properties. It’s an object. In the d3 world, the properties could be what goes in the attr method. So when you create an SVG element like a rect, its properties could include things like x, y, width and height. In d3, style is treated slightly differently. This is also the case in React. When using React.createElement with an HTML or SVG element, that could be styled using CSS, you can use a style property to pass a style object. That style object contains all CSS properties you want to apply to the object, but instead of hyphenating them, they are written in camel case (so font-family, for instance, becomes fontFamily). The third argument is content: it can either be a string, a single React element, or an array of React elements. In the first line (mySpan) we’ve used a string. So, this first line created a React element which is a span, which contains “hello React world”, and which has a simple style applied to it. In the second line, we create a second React element. Again, React.createElement takes three arguments: type of element (now it’s an HTML div), properties and content. Instead of providing a string, we can pass another React element, such as mySpan that we created above. And that’s it! we’ve rendered something using react.

Creating elements from data

In the example above, we’ve used React.createElement with two kind of content: a string and another React element. But I mentioned that there was a third possibility: an array of React elements. If you’re familiar with d3, you might think: in d3, I could do that from an array of data. The idea in React is pretty similar, only, instead of using select / selectAll / data / enter / append, we can just create our array.

See the Pen React simple scatterplot by Jerome Cukier (@jckr) on CodePen.

One simple way to do that is to use map: myArray.map(d => React.createElement(...)). This is exactly what we are doing in the snippet of code above. This uses the birthdeathrates dataset, one of the example files provided with R (number of births and deaths per thousand people per year in various countries.) The interestingness happens here:

birthdeathrates.map(
  (d, i) => React.createElement('div', {
    'key': i,
    'style': {
       background: '#222',
       borderRadius: 5,
       height: 10,
       left: 5 * d.birth,
       top: 300 - 5 * d.death,
       position: 'absolute',
       width: 10,
       opacity: .2}
  })
)

In the properties that I pass, some depend on the underlying data. This is a mapping so it’s going to return something for each item of the array. Each item of the array is represented by d, and has the birth, death and country properties. In left and top, we use a calculation based on these properties. And for each item, we get a React element created with these calculations. This isn’t unlike what we’d had in d3 if we had written:

 ...
 .selectAll('div')
 .data(birthdeathrates)
 .enter()
 .append('div')
 .style({ ..., left: d => 5 * d.birth, top: d => 300 - 5 * d.death, ...})

Take note of the key property in the react code. This is necessary when you create many elements using map (well not really necessary but strongly recommended, you’d get a warning if you don’t use it). This is used so that if for some reason your parent element has to re-render, each child element will only be re-rendered if needed. If you’ve followed this far, you are now capable of doing things in React the critical part of what you were doing with d3: creating elements out of data. You might wonder: but does it work for svg? yes, and the logic is exactly the same:

See the Pen React simple scatterplot by Jerome Cukier (@jckr) on CodePen.

Introducing JSX

See the Pen React simple scatterplot JSX by Jerome Cukier (@jckr) on CodePen.

At this point you might think: all of this is great, but typing React.createElement all the time is kind of cumbersome. Many people do too, and there are a number of ways to not do that. The most popular, and the one in use at Facebook, is JSX. I personally use r-dom most of the time, but since JSX is definitely the most common way to write React, now that you have a feel for what React.createElement does, it’s not unreasonable to continue with JSX.

The main idea of JSX is that you’ll write tags in your javascript. Instead of writing:

React.createElement('type', {property1: value1, property2: value2, ...}, content)

you would write:

<type property1={value1} property2={value2} ...>
content
</type>

So in our previous example, we create an SVG element that has a width and a height property.
We’d write:

const svg = <svg height={300} width={300}>
//... content ...
</svg>

Inside the opening tag, we list all the properties and we give them a value. This isn’t unlike what you’d see when you watch the source of an HTML file.
The value of the properties go inside curly braces, unless they are a string. For length-type values (ie height, width, top, left, font-size…) if a number is provided, it’s assumed it’s in px.
If the element we create has other elements inside of it, there has to be an opening and a closing tag (ie <element> and </element>). But if there isn’t, there can be a single tag (ie <element />)
Inside our svg, we have a bunch of circle elements. They are of the form:

<circle 
  cx={5 * d.birth}
  cy={300 - 5 * d.death}
  key={i}
  r={5}
  style={{
    fill: '#222',
    opacity: .2
  }}
/>

inside our curly braces, we can have calculations. And since there are no elements inside our circles, we don’t have to have both a <cirlce> and a </circle> tag, although we could; we can have a single <circle /> tag.

That’s it in a nutshell, more details can be found here.
Now you might think: if I type that in my text editor, I’m almost certain I’ll get an error! Indeed, behind the scenes, there has to be some transformation for your browser to understand JSX. This magical operation is called transpilation. Transpilation is just what you’d hope it is, it turns code written how you like into code that the browser can interpret flawlessly. The flip side is that… well, you have to transpile your code.
If you work into environments like codepen or JsFiddle, they can take care of this for you. The most common transpiler is Babel. Babel turns your code into ES2015 compliant javascript (that is, before ES6). So the added bonus is that we can use any ES6 feature without wondering whether the user browser supports it or not. Most ES6 features are supported by the latest versions of many browswers, but there’s no guarantee that your users will run your favorite browser, let alone its latest version.
If you want to do this on your own, you’ll have to set up a build environment, we’ll cover this in the last two articles.


D3 and React – similarities and differences


Previous article: Visualization with React

d3, meet cousin React

Let’s not sugarcoat it: working with React is more complicated than with plain vanilla javascript. There are a few additional notions which may sound complex. But the good news is that if you come from the d3 world, there are many concepts which are similar. Visualization on the web is, at its core, transforming a dataset into a representation. That dataset is probably going to be an array, and at some point the framework will loop through the array and create something for each element of the array. For instance, if you want to make a bar chart, you probably will have at some point an array with one item that corresponds to each bar, which has a value that corresponds to its length. Looping through the array, each item is turned into a rectangle whose height depends on that value. That logic, which is at the core of d3 with selections, is also present in React. In d3, visualizations are essentially hierarchical. We start from an SVG element (probably), add to it elements like groups, which can hold other elements. To continue with our bar chart example, our chart will have several data marks attached to it (the bars), and there’s a hierarchical relation between them: the chart contains those marks. Our chart could be part of a dashboard that has several charts, or part of a web page that has other information. At any rate, in the d3 world, everything we create is added to a root element or to elements we create and arranged in a tree-like hierarchy. This is also the case in React, with a difference: the world of React is mostly structured into components. When that of d3 is mostly made of DOM elements like HTML or SVG elements, that of React is made of components. A React component is a part of your end result. It can be as small as a DOM element, or as big as the whole application. And it can have component children. So, components are logical ways to package your application. Components are created with modularity and reusability in mind. For instance, I can create a bar chart component in React, and the next time I have a bar chart to make, I can just reuse the exact same component. I can also create components to make axes or the individual bars in the chart, which my bar chart component will use. But the next time I need a bar chart, I wouldn’t have to think about it. In contrast, if I want to create another bar chart in d3, I probably have to recreate it from scratch and decide manually what happens to all the SVG or HTML elements that constitute the bar chart.

You say dAYta, I say da-tah

One fundamental way in which d3 and React differ is by how they treat data. If you read about React, you may find fancy terms like one-way data binding. In how many ways the data is bound in d3 is not something which is on top of our head when we create visualization so that might sound confusing. In d3, an element can modify the data which is associated to it. I’ve used it so many times.

See the Pen React simple scatterplot by Jerome Cukier (@jckr) on CodePen.

These bars have been made with a very simple dataset shown below them. If you click on the bars, the underlying data will change and the representation will change as well. In the world of React, when properties are passed to a component, they cannot be changed. That’s what one-way binding means. Data in React flows unidirectionally. Once it’s defined, it determines the way all components should be displayed. In certain events, a parent component can pass different properties to its children component and they may be re-rendered (we’ll see this in just a moment). But the important part is that properties passed to a component can never be changed. You may wonder: why is that even a good thing? React makes it impossible to do things! yes, but in the process it also makes things much safer. If properties can’t be changed, it also means that they can’t be altered by something we hadn’t thought of. Also, it makes it much easier to work on components independently: one team mate could make a bar chart component while her colleague makes a line chart. They don’t really need to know the inner working of the other component, and they know that nothing unexpected will disturb the way their component function.

The state of affairs

Components of React have a really powerful feature which doesn’t explicitly exist in d3: the state. The state represents the current status of a component. Here’s a simple switch component:

See the Pen React simple scatterplot by Jerome Cukier (@jckr) on CodePen.

We want to record the fact that the switch can be turned on or off. Here’s how it should work: First we create our switch component, and it’s supposed to be off. Then, if the user clicks it, it becomes on if it were off and vice-versa. And it should also be redrawn, to reflect that it’s been turned on (or off). The state does all that. It records the current status of the component. Technically, it’s an object with properties, so it can save a lot of information, not just a simple true or false value. The other great thing about the state is that if it changes, then the component is re-rendered. Rendering a component could require rendering children component, and they may be re-rendered as well. So with the state and properties, we have a powerful framework to handle events and whatever may happen to our app. If there’s an event we care about, it can change the state of a component, then, all of the children components may be re-rendered. And there’s no other way to redraw them. This is in contrast with plain d3 where anything goes – anything can change anything, data can be used to render elements, the underlying data can be changed without changing the element, the element can be transformed without changing the underlying data.

State is an important notion in computer science. In d3, it’s just doesn’t have a more formal representation than all the variables in your code.

In the next article in the series, an ES6 Primer, we will look in some useful ES6 features for React.


Visualization with React

Some back story…

In what seemed a lifetime ago now, I wrote tutorials to help people get started with Protovis as I learned it myself (it is indeed a lifetime away since Protovis is dead and buried for all intents and purposes). And a few years ago, I did the same for d3 as this started to become the most powerful visualization framework and for which documentation was still scarce. I wrote these tutorials to help me learn, but since then I have met many people who found them useful which blew my mind. By documenting my learning, I got noticed by Facebook and travelled 9000 miles to a new life.

At Facebook, I had some loosely-defined data visualization explorer role. While I joined during the infancy of React, I didn’t feel super comfortable using it then – I felt more effective writing one-off d3 applications. Eventually, I moved on and am now working at Uber as a fully-fledged data visualization engineer. I work almost exclusively with dashboards, which have a pretty elaborate UI.

Like in many other companies, at Uber, we use React for our web applications, including our visualizations, dashboards and maps. Increasingly, React is becoming the lingua franca of visualization: more than a tool that allows one to draw data, a mindset that informs how one should think a visualization. React is no longer a young library – the initial public release dates back from May 2013, and its very first application at Facebook was visualization (my first Facebook project, pages insights). There’s already many, many learning resources and tutorials for React. What I’ll try to do here is to show how React can be used for visualization: hopefully, this will be useful both for people who come from d3 and who’ve never worked with a web framework before, and for people who are familiar with React but who don’t know visualization well. That won’t be a complete and exhaustive guide, more a way to get started with references on how to go further.

The articles

I’ve structured this guide in 7 parts, and I’ll publish one per day:

  1. React vs D3, where we’ll explore similarities and differences between these two frameworks.
  2. An ES6 primer. I have written all the examples in good, sensible, modern ES6 javascript, because as of 2016 this is probably the most common syntax. Without going too deep into the details, I’ll explain what parts of the language I used for the examples, and how they differ from ES5.
  3. Gentle introduction to coding with React, where we’ll explore the high-level concepts of the framework and see how we can create visual elements from data. We’ll end on a presentation of JSX, a flavor of Javascript used to write React applications, which I’ll also use for most of the examples for the same reasons as ES6 – because it’s the most widespread way of writing React code today.
  4. React components, the most important concept in React and the building blocks of React applications.
  5. Beyond rendering. We’ll look at the React concept of lifecycle methods, and also how we can use d3 within React components.
  6. Creating a React visualization web app – using what we’ve seen, and two libraries – Facebook’s create-react-app and Uber’s React-vis, we’ll create a small standalone React visualization that can be deployed on its own website.
  7. The big leagues – in that last part, we’ll write together a more complex visualization with live data and several components interacting with one another.

The code

The examples of parts 1-5 can be found on codepen. I’ll add link to examples of part 6 and 7 when they go live.